Learn more about the characterization of materials, X-ray fluorescence technique "used to study semiconductor compounds
That such friends a few days ago talked a lot about the structural characterization of materials using different techniques by means of electron microscopy (see the links at the end of the post). On this occasion I want to continue with the same line of publication, several weeks ago explain what the [X-ray diffraction technique] consists of using the dust method, this technique is the most used by us in the LEMIN, this technique same as the others used with SEM and TEM , they serve to determine crystalline phases, structures, chemical composition, surfaces of materials, etc.
Now to complement the aforementioned techniques, this time I will talk about a technique complementary to the previous ones, and it is the X-ray fluorescence (XRF), this technique is important for the study in materials science. In the same way it serves to determine crystalline phases and composition of materials through a diffractogram.
What is the x-ray fluorescence?
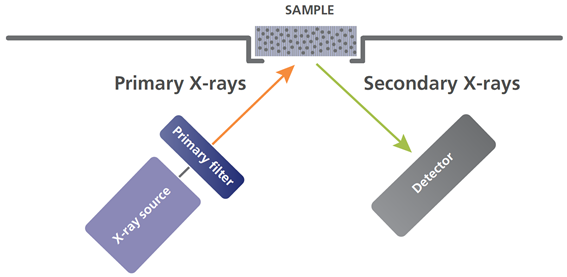
In a very general way, we say that a beam of electrons has been incised on the sample placed to characterize, this electron beam bombards the sample when it hits it, the internal electrons of the sample come out of it and these electrons are detected, the sample emits a secondary radiation of x-ray fluorescence and records the intensities as a function of the wavelengths.
Source
The XRF technique and the other techniques explained by me complement each other and it should be noted that the main function is to be able to determine the chemical composition of elements, and remembering that it means, it is only being able to obtain the exact percentage of each element, compound or characterized material, for example we have the CuInTe, this element was grown in an equitable way that is to say, we added 33.99% of each material at the time of the synthesis and simply this technique provides us with the necessary information to confirm this, the most important part is to be able to see through the diffractogram where each percentage of the element in the ingot is, because normally during growth the elements are scattered throughout the container until they are completely synthesized and solidified.
This analysis is carried out with a spectrometer and from there we obtain the spectrum of x-ray fluorescence, later the results will be analyzed by a computer program, then I will continue explaining the technique in a theoretical and experimental way.
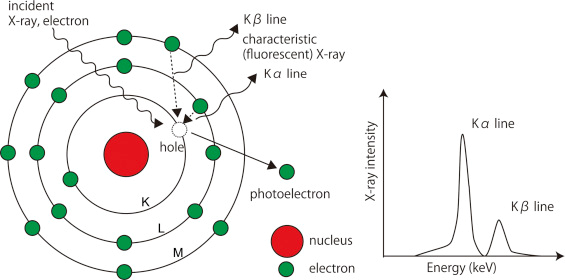
Explaining it in a theoretical way and using the theory of bands we can say that each element has electric orbitals that have their peculiar energy, when bombarding the electrons and exiting the electrons of the sample, an electron jumps from the inner to the outer layer, leaving a gap that will be occupied by another electron, is the same thing that happens in the hollow pair-electron explained previously in another publication. This jump from one layer to another emits an energy in the form of a photon and these transitions are the following:
Transition L → K: Kα
Transition M → K: Kβ
Transition M → L: Lα, and so on.
Each transition generates a fluorescent photon whose energy is equal to the energy difference between the initial and final orbitals. The λ of this fluorescent radiation can be calculated from the Planck equation (E = hλ ).
sciencedirect
Components of the XRF.
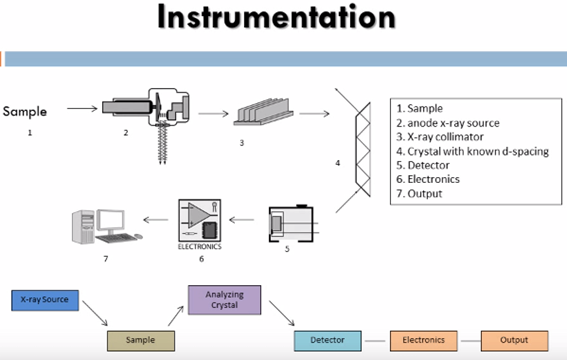
To apply the characterization technique, two types of configurations are used: wavelength dispersion spectrometry and energy dispersion. But basically the following figure shows the main instruments that are used to configure the measurement system.
In general, a system is used that produces the x-rays that go towards the sample that is known as the x-ray tube, which is where the electrons flow when they are bombarded.
Also a spectrometry camera that is capturing the signal by means of the detector that in turn has an associated optics, which would be the mirrors are refracted electrons.
And also a detection system that in turn register the intensities and wavelengths.
metallurgist
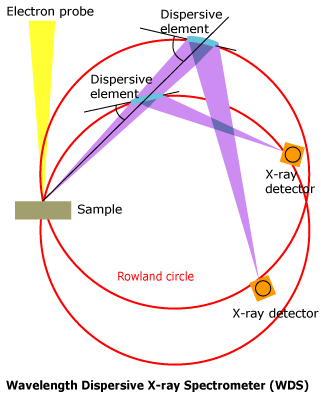
Dispersive wavelength instruments.
This type of instrument always uses tubes as a source due to the large
energy losses suffered when the X-ray beam is collimated and dispersed giving its component wavelengths. The dispersive instruments of wavelengths are of two types, of a single channel or sequential, and multichannel or simultaneous.
Dispersive energy instruments.
slideshare
For some samples that contain very few elements and their X-ray lines are very far apart in wavelength, the analyzer crystal can be eliminated and dispersive energy detectors with pulse amplitude discriminators used instead. This type of instrument consists of a polychromatic source (which can be an X-ray tube or a radioactive material), a support for the sample, a semiconductor detector, and various electronic components necessary to discriminate the energy.
The configurations are explained in a previous post see here
To conclude we can say that the XRF technique is very important to determine crystal systems, phase identification, wavelengths, peak and intensities of different material compounds, can be coupled to the WDS as a characterization instrument, its importance lies mainly in identifying compositions Elemental chemistries in semiconductors, as far as I am concerned, I use it a lot for this purpose since it is an essential part to study the physical behavior of semiconductor compounds and the results and different technological applications depend on it.
Credits:
http://www.horiba.com/scientific/products/x-ray-fluorescence-analysis/tutorial/xrf-spectroscopy/
https://projects.exeter.ac.uk/geomincentre/estuary/Main/xrf.htm
https://www.911metallurgist.com/blog/x-ray-fluorescence-spectroscopy
http://www.labsax.cl/gallery/introduccion%20a%20la%20frx.pdf
http://cienciayrestauracion.blogspot.com/2013/10/la-fluorescencia-de-rayos-x.html
If you want to learn more about microscopy visit my previous publications:
And if you want to learn a bit about semiconductors you can also visit the following publications:
Thank you very much for the support from you @steemstem
Muy estimado amigo @carloserp-2000. Con la técnica de FRX no se determinan fases cristalinas. Esta técnica le da composición en forma de elemento. Por ejemplo, si usted somete a molturado una muestra de cemento al punto de obtener un talco y lo mide por FRX, el resultado será un elemental donde le mostrará en forma de porcentajes de lo que está compuesta la muestra, por ejemplo calcio (Ca) en un 50 % ó silicio (Si) en un 30 %, entre lo más importantes. Esta información me sirve en la parte de DRX para realizar un semicuantitativo. Por decir algo, de ese 50 % de Ca el estará en forma Carbonato de Calcio, Óxido de Calcio o sulfato de calcio. En cuanto al Si, ese 30 % estará distribuido en cuarzo bajo, cuarzo alto, entre otros.
Otra cosa, con FRX no se determina sistemas cristalinos. Esto se hace con DRX. Recuerde que la realizar una toma de datos por DRX se obtiene un difractograma donde es posible identificar las fases cristalinas, realizar indexado para determinar los parámetros de red, el sistema cristalino y el grupo espacial, tamaño cristalino, estrés, entre otras cosas. FRX, sólo le da elemental.
I just did such an analysis on alloys. In fact, nowadays it is not easy to make a quality analysis of alloys, and here it is necessary to turn to a professional instrument that can help. So be sure to study in detail here more info about this device and how it can be used if you also need to do a competent analysis of alloys. You just can't do without it nowadays. I hope I was able to help someone.