Do you know semiconductors? your answer is no... "I will explain to you very easily" Part # 8
In the previous post talk about the X-ray powder technique, show the equipment used to run the runs of these polycrystalline semiconductor samples, talk about how this diffraction equipment is composed, the methodology used to develop the analysis of the sample and the theoretical introduction based on Bragg's law.
After explaining all this experimental part comes the interesting part is the study of the data thrown by means of this technique, which would come to be the qualitative analysis of a semiconductor compound, then I will explain step by step how this analysis should be done, but before doing a brief review on how is the sample preparation before performing the sweep with the D8-Bruker diffractometer.
In order to start any type of characterization already electric, optical or in this case structural, the preparation of the sample to be measured must always be made, that is to say, the crystalline sample is milled until obtaining a fine and homogeneous powder, that is why the name of the technique "powder X-ray diffraction". In this way the small crystals converted into powder are oriented in several directions, so that at the moment of impact the electron beam can traverse the material and thus the condition of the law of Bragg can be fulfilled for the reflection of all possible spaces in the sample.
Subsequent to its preparation, the crystals are placed in said sample holder, placed horizontally or vertically, this is done according to the configuration of the diffractometer and is rotated to minimize the effects of preferential orientation and favor the orientation of the crystals at random. The diffractometer consists of a mobile X-ray detector that registers the intensities as a function of the 2θ angle, to obtain the diffractogram of the compound, which would be the most important part from now on.
It collects the data obtained from the intensities as a function of the 2θ diffraction angle, as already mentioned above, in the (figure 1) we obtain or can observe a series of peaks expressed in values of θ. On the sample the radiation is incident with an angle of incidence alpha. If in this orientation a crystalline plane (h, k, l), of interplanar distance dhkl, fulfills the condition of Bragg, a diffraction occurs for θ= alpha.
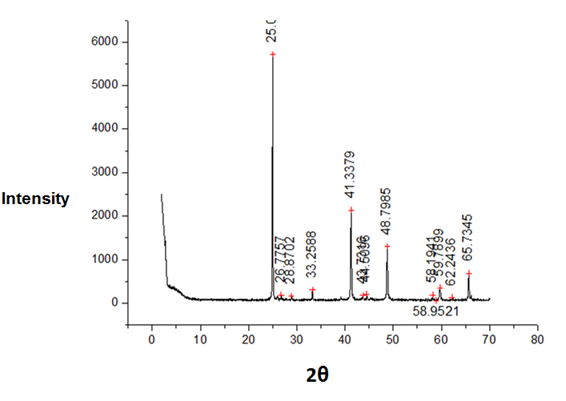
Figure 1. Diffraction pattern.
The intensities are the heights of the peaks, the most intense peak is assigned a value of 100 compared to this. These peaks provide very important information about the polycrystalline sample.
This technique is very useful for determining crystal structures, systems and phase identification in a crystal.
At the time of the experiment we must also take into account certain conditions such as:
Control the parameters to be used, for example the power of the tube, that is to say, this influences the intensities when it is diffracted by means of the crystalline sample, we can control the voltage of the tube, which in turn is where the electrons that will emerge from the cathode to the anode. Similarly we must control the windows of the equipment (divergence and dispersion), these windows also influence the intensity of the diffraction peaks, their resolution, noise and the width of the peaks.
The intensity of the diffraction peaks is a very important factor when structurally characterizing a semiconductor or any type of crystal, and there are 6 factors that determine this intensity in the diffraction diagram which are the following:
- Polarization factor.
- Factor structure.
- Factor of multiplicity.
- Lorentz factor.
- Absorption factor.
- Factor of Temperature.
At the moment of looking at the diffractogram we can see certain particular details, for example: a peak is more intense than others, or wider, or are simply run some degree on the x-axis, and this is due to the combination of different factors that at the time of sample scanning, have a significant influence on the analysis; can be calibration of the equipment or other any instrumental factor, also influences the microstructure of the sample, that is, all are different, some are simple or other crystals combined with each other, prepration is also essential the way the powder crushes and you place it in the post sample, it depends on the amount (little or much percentage of the compound). The power with which the beam affects the sample, in conclusion are due to several factors but the most important are: the size and tension of the crystals.
Now after explaining all the experimental procedure and how to obtain an X-ray diffractogram comes the qualitative analysis that in my personal opinion and due to my little experience is simple, I will show you what I do when analyzing these diffractograms.
There is a great variety of computational programs that have an extensive database that report different patterns of diffraction, that is to say, semiconductor compounds already studied that are annexed by means of a letter crystallography that comes in within the packages of computational programs like for example: search-match, fulloprof, power diffraction, xspert, among others.

Figure 2. Computer program logo.
I in particular use the Search-macht as it has a very extensive library with reports of all semiconductor compounds already studied for example in the following figure 3:
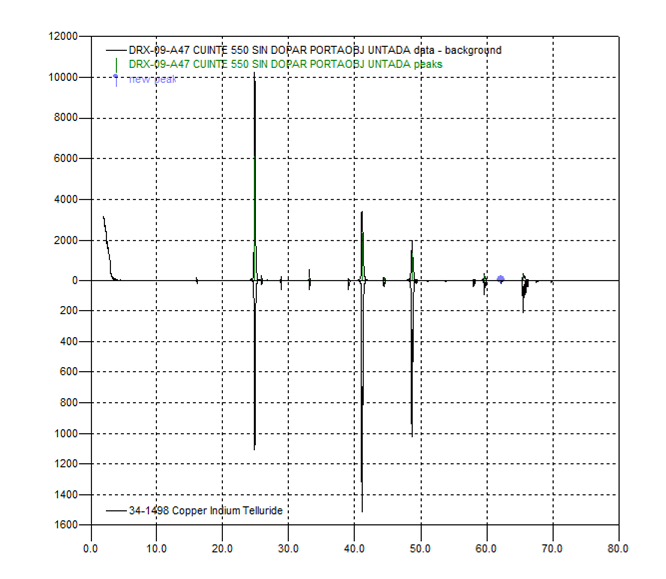
Figure 3.Diffraction pattern obtained from the computer program Search Match.
In the previous post I showed a similar figure where at the top and bottom two diffraction patterns are shown and the question is how can I visualize them?
At the moment of obtaining the X-ray diffractogram this generates a file to you, you can open this file in any computer program of analysis of diffraction patterns as already mentioned.
It generates a figure like the previous one and the program has an option where you can search by means of the database of diffraction patterns that coincide with that you entered and will automatically perform a comparison of peaks with their respective intensities and location in 2θ. This is done in order to be able to check if there are any spikes that are not reported in the program database. If not reported means that it is a new phase, this happens mostly when the compounds grown, have some excess of chemical concentration, happens in ternary and quaternary compounds.
This program gives you a complete analysis of all the peaks of the diffraction pattern (figure 4):
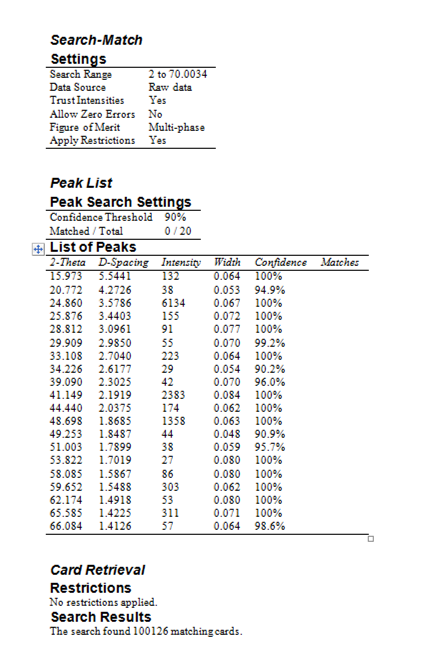
Figure 4. Crystallographic chart of the diffraction pattern (the peaks taken by the serach match program database are observed).
You can observe each peak of the diffraction pattern with its respective intensity, interplanar distance and location, in some cases the program does not take some peaks that are intense, then it gives you the option to manually add them and attach them to this crystal chart.
The next step would be the indexing of these diffraction peaks, in order to obtain an accurate profile of the diffraction peaks and confirm the existence of secondary or additional phases, in addition to determining the crystalline system and parameters of the unit cell.
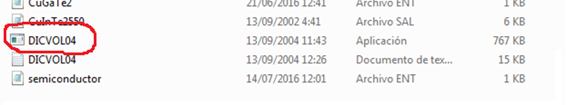
To do the indexing I do it through another computer program in this case a file configured or created as .exe, its name is DICVOL2004.
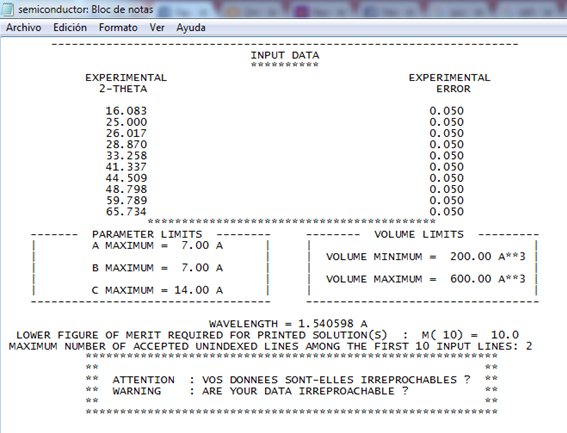
A blog of notes is created where you place the 10 most intense peaks of the diffraction pattern and follow the indications of the user manual that the program brings.
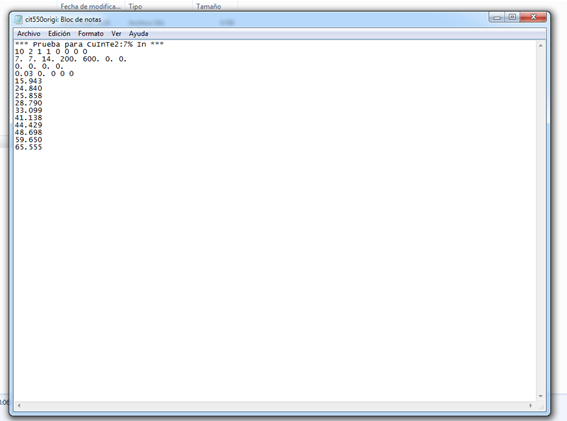
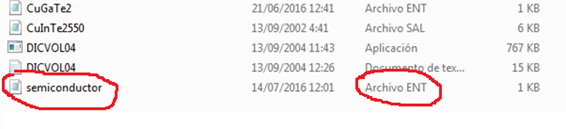
The figure shows how to create the blog of notes for later indexing, then the file you must put a specific name and generate an input file for example:
Semiconductor.ent
Then you enter that file into the executable application of the program.
You open the file and you'll see something like this.
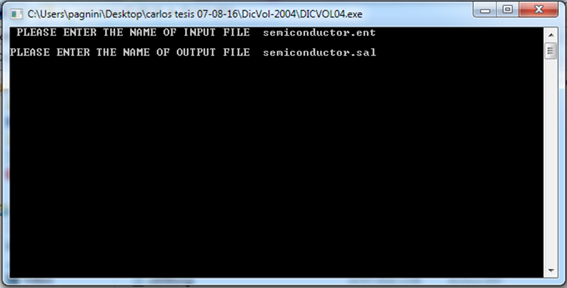
You must place the input file presses on your keyboard enter and then asks you to place the name of another file in this case the output, which will be the one that gives you all the information regarding the indexed.
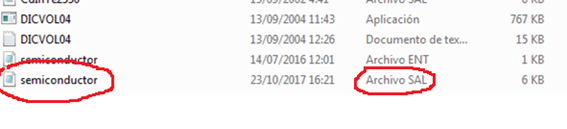
The output file will be automatically displayed in the program folder.
And finally you get the detailed indexing information.
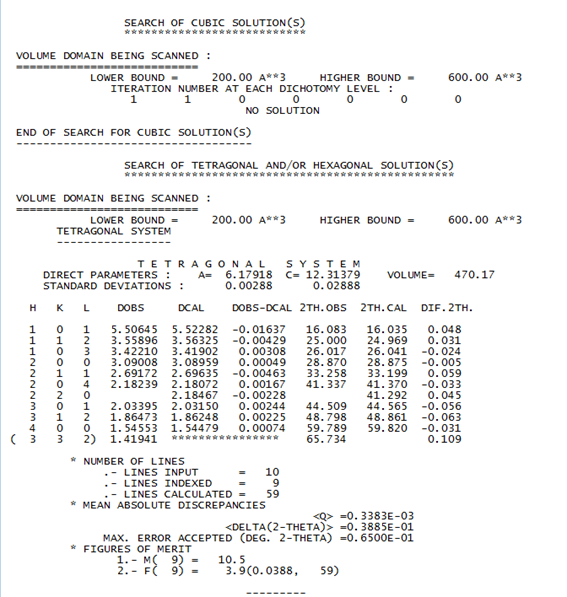
The figures show the detailed information of the indexed as they can observe the indexing gave as final solution a tetragonal system with its different indeices of miller, intensity, interplanar distances. In the part where they show the number of indexed lines it can be observed that of the 10 peaks only index 9, it is usually due to an error by us at the moment of identifying a diffraction peak or there may be the possibility that it is a phase not reported.
Well as a conclusion to this post it can be said that the qualitative analysis is very important to be able to identify the appearance of additional phases or to determine a crystalline system, just as it is possible to mention that the preparation of the sample is essential and of course the proper calibration of the diffractometer to obtain a suitable diffraction profile, it is also very important to study the theoretical part of X-ray diffraction because it makes it easier for us to understand the behavior of this very particular phenomenon, carrying out the qualitative analysis carries with it an earlier study of management of programs and software, it is always important to perform computer courses for easy management of such programs.
References:
- http://personales.upv.es/~avicente/curso/unidad3/determinacion.html
- https://es.wikipedia.org/wiki/Cristalograf%C3%ADa_de_rayos_X#Rayos_X
- https://www.upct.es/~minaeees/difraccion_rayosx.pdf
- User manual Dicvol 2004
thanks duderino
https://steemit.com/steemstem/@light-o-trix/defense-strategy-and-capabilities-development-across-the-globe-is-it-a-threat-for-the-human-race
you are getting flagged for dropping links on people's posts. This is very bad behaviour.
Sorry I was unaware of the tagging process, I am new and just learning. From next time onward I will utilize your valuable guidance. Thanks for informing me!!