1/10/2017 The Market View and Trading Outlook
Have we found the floor? Perhaps so, and perhaps not. In the short term we may have a run up today, and tomorrow, providing us with an opportunity to make a nice profit. I have been accumulating $230-ish priced Litecoin as well as BCH in the $2350-$2450 range. I don’t really have a summary of what’s to come as there are two potential scenarios on the horizon and I’m giving each one due respect. The first being that BTC is in a corrective triangle pattern and will go up to just below $16,700 prior to falling back into the $14,400 range once more before making a much larger move up. The second we have a bear flag, in which case BTC may shoot up to $17,000- $18,000 or better before a much more severe correction begins that could see price in the sub $10,000 range.
So lets get to it.
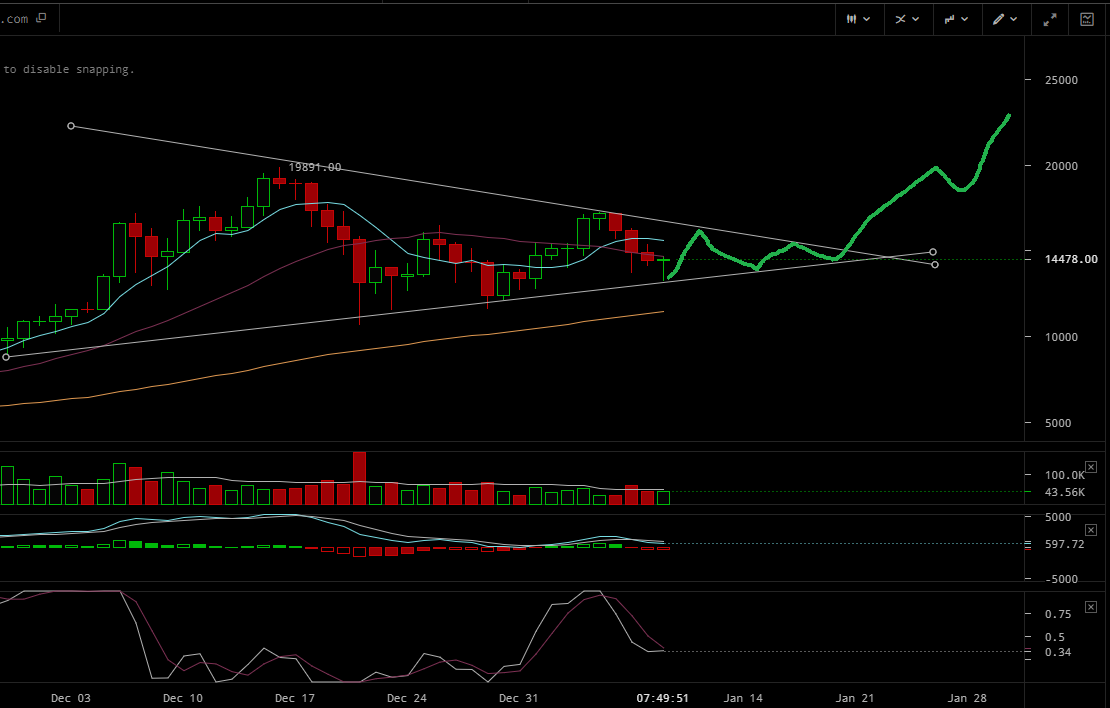
A bullish 1 day scenario would play out somewhat close to the drawing above. We get a nice bounce over the next few days as the 12 hour, 1 Day, 4 hour, 6 hour etc. go green. Price pushes up towards $16,800 and then corrects back down to $14,400-ish into a narrowing range, goes up again, down again and then makes a break out of the channel. This would be the most bullish scenario and would keep price above the MACD 0 line.
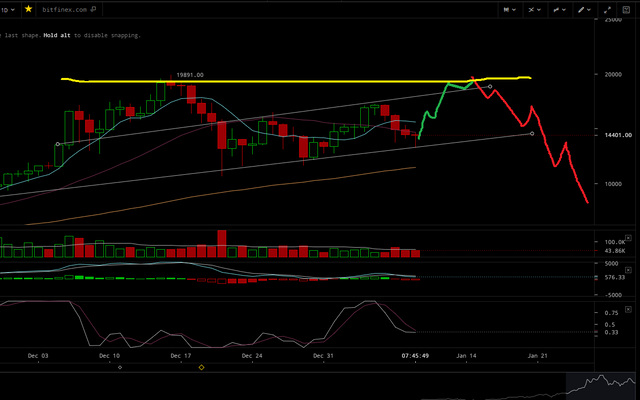
A bearish scenario is that price goes on an upwards tear to near all time highs, leaves the longer term moving averages behind, has no support and then comes crashing down with sufficient momentum to break the MACD 0 and send us sub $10,000.
As I trade and do not HODL it really makes no difference to me in which direction it chooses to go as I will find buying opportunities along the way. In reality the only big decision would be moving coins to Kraken to short hard if I see the bearish scenario coming to fruition.
******************Edited************
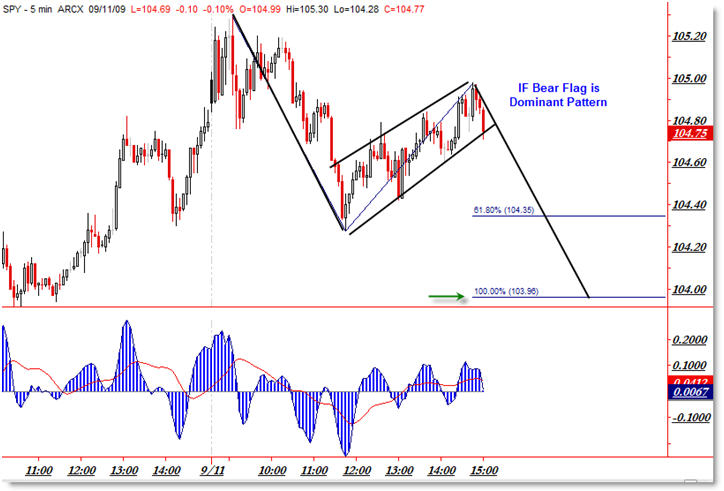
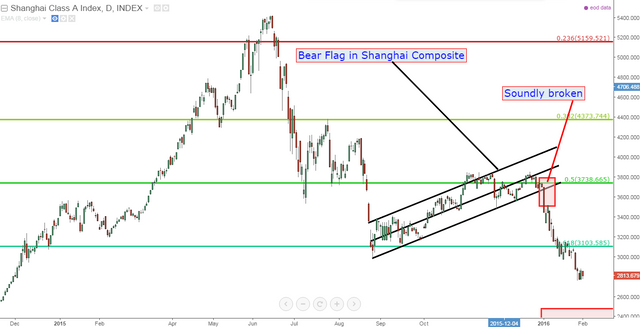
Just wanted to add in what Bear Flags actually look like..
Onto the 12 hour.
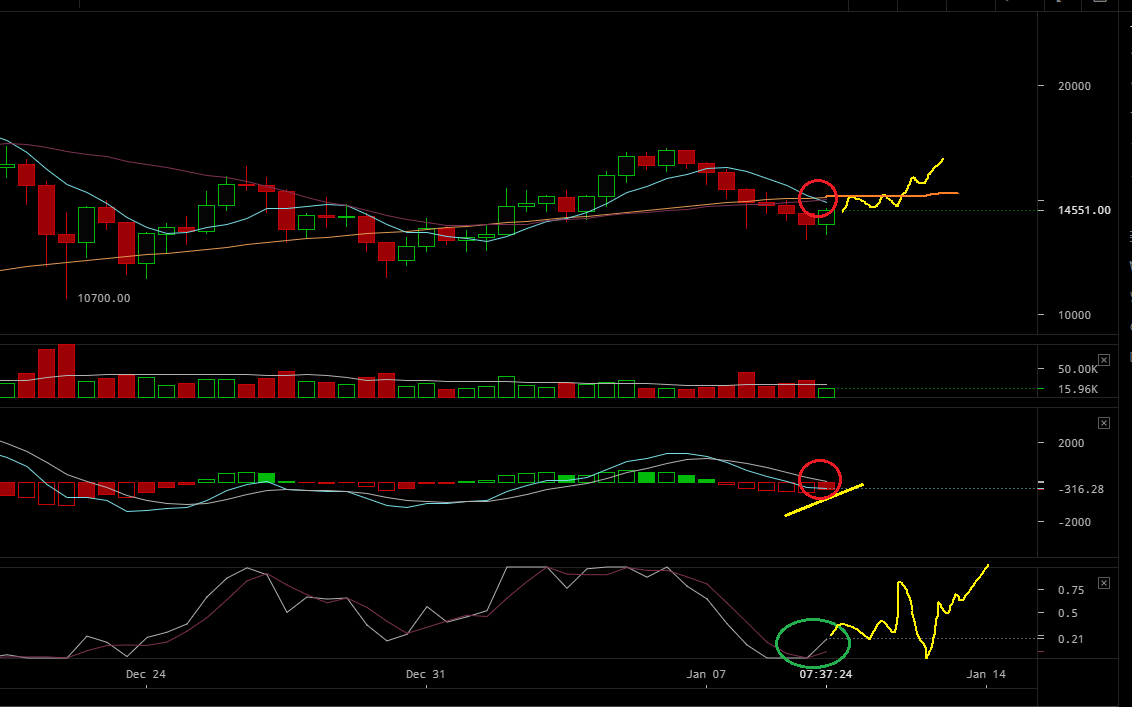
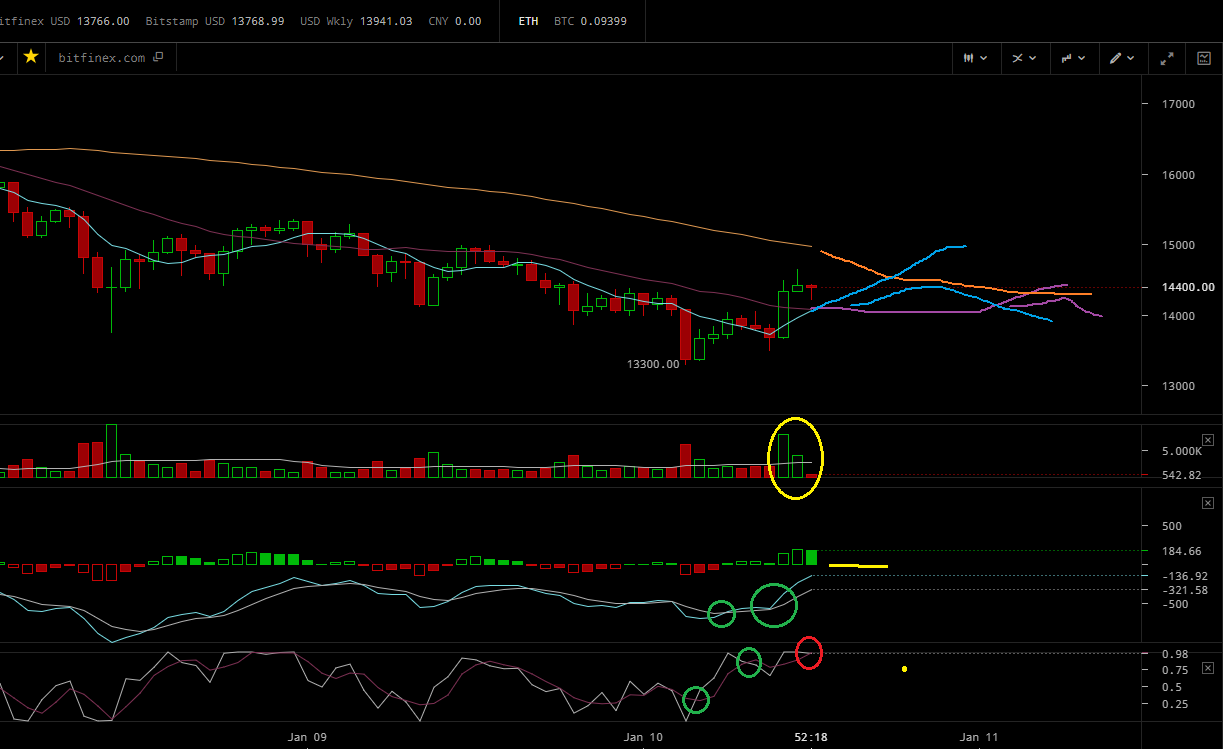
The MACD histogram shows that the most recent selling period “may” be coming to an end which will provide us with a buying opportunity. We have tremendous downside divergence between the MACD and Signal line, and the RSI has us in oversold territory with an upside cross; all neutrally bullish and none are super strong buy indicators. The RSI has not been in oversold territory as long as it usually is for this time period and seems to be attempting a straight bounce from the bottom. These usually fold midway up in the .38-.65 range before heading back down. That said a fold could also be the bullish scenario setting up if BTC corrects back down from $16,600 to put RSI on 0 again before pulling upwards. We do have a 7/77 downwards cross which is bearish, but as the delay is so extreme in this time period losses related to this are not an immediate event. The most probable scenario is that price will trend along just below a slowly rising 77 for a while as the shorter time frames attempt to get us too and hold above $15,000. As I stated a few days ago $15,000 is a key battleground for the moment.
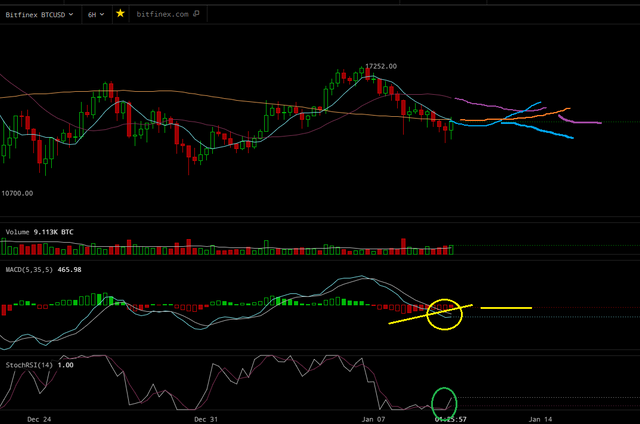
The 6 hour has provided the first buy indicator in the form of an RSI crossover, on a decreasing MACD histogram to the upside. That said we DO NOT have an MACD/Signal line cross (secondary buy indicator) and the 7 just crossed below the 77. Again you have to account for the delay in the moving averages and it is likely price will tread water around or just above $14,500 for a bit longer as the lesser time frames make upwards or sideways moves. We are also below the MACD 0 line which will serve as resistance to the upside and may help us in the long run as that may be the rejection point for the triangle pattern I mentioned above. Price will hit the 0, or the 21 day moving average at $15,700, get rejected back down to the 77 and build some upwards momentum from there as investors become more secure in a +14,500 floor. I have included projected bullish/bearish trend lines.
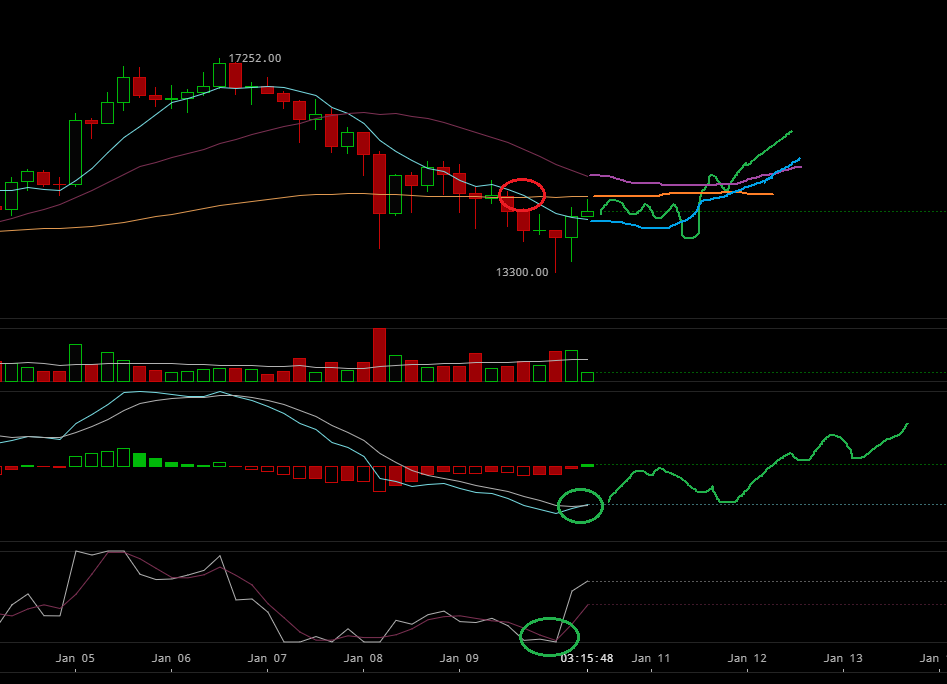
The 4 hour is looking considerably less ugly than it was yesterday. We do have our first green bar of a new buying period on the MACD histogram, and we have 2 of 3 buy indicators thus far; an RSI upwards cross as well as an MACD/Signal line cross to the upside. That said we do not have moving average confirmation and we are still shaking off the effects of the previous 7/77 downwards cross at $14,700. As there is a delay in moving averages that grows exponentially as you increase the time frames it is probable that we have already absorbed the effects of the aforementioned 7/77 downwards cross. In this scenario the 21 will stay above the 77 and price will struggle along under the longer term average for a bit before breaking through. We are below MACD 0, so it will serve as upside resistance and we are just below it which is indicative of low upside momentum. The further down it goes, the faster it rises, so when the MACD is say less than 30 percent below the 0 it tends to struggle breaking through. This would coincide with one or two more upcoming rejections at the longer term 77 and this 4 hour buying period being somewhat short and uneventful in the grand scheme of things. This should then be followed by another short sell, and then hopefully a longer running buy that decisively breaks upwards of the 77 and MACD 0.
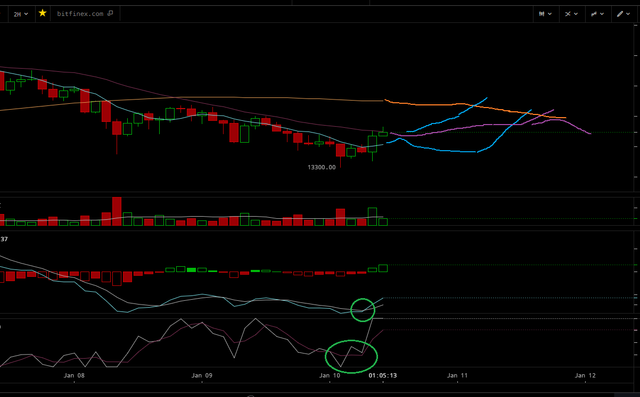
The two hour looks a little better than yesterday but objectively speaking it is still not giving me a lot to work with. Price is struggling to break the 21 at $14,450 and we have not had a bullish moving average crossover. What I want to see to start is a 7/21 cross to the upside below the 77. We do have two of three buy signals again in the form of an RSI cross from the oversold territory and an MACD/signal line cross at the bottom of its range. I tend to put more weight on low MACD crossover as price is pretty much at the bottom and the easiest pathway from that point is usually up before fighting with the MACD 0. While there are some bullish indicators, the 7 has not crossed the 21 and is just as likely to get rejected back down for a lower low at $14,500 which would put us at $13,200 or $12,900 sometime in the early A.M. of 1/11. Ideally, price needs to hold above $14,000 so as the 7 can move laterally through the 21 and provide a third potential buy signal. My projected trend line are included but I am not definitive in direction as at this stage it’s like hurricane forecasting while the storm is still well out into the Atlantic.
The one hour, rarely do I make buy decisions in the 1 hour as there is just not enough momentum in this frame to confirm reversal of trend and you can get whipsawed around quite a bit. However, as we are at a somewhat critical intersection, I can use this time frame to potentially forecast what the 2 hour may do. Still not much to work with except we are “potentially” very close to a 7/21 upwards cross beneath the 77; a weak buy indicator. Price may break upwards of the 21 only to be smacked back down at the 77 and MACD 0. We have numerous weak crossover events on the MACD/Signal line and none are as of yet definitive. To play it very risky would be a limit order at $14,150 and then HODL or sell as it fights to break the 77 at $14,800-ish. Price needs to sustain above $14,500 to start the first moving average crossover and ideally fight through, above and hold $15,000 to let the larger time frames begin to make their moves.
The 30 is fighting the 77 at $14,400 and will likely get rejected. The 15 is above the 77 and extended from the longer term average which sits at $14,041. Look for a pull back to around that level and hopefully not below it in the very very very very short term. If it bounces the 77 on the 15 it may give the 30 some juice to break above $14,400, which will then pull the 1 hour into a 7/21 upside cross and initiate a small recovery period in price.
DO NOT PLAY THESE SHORTER TIME FRAMES FOR DECISION MAKING IN REGARDS TO BUYING AND SELLING. THESE TIME FRAMES ARE THE ONES THAT HURT THE INEXPERIENCED AND GET THEM WHIPSAWED AROUND BUYING TOPS, BUYING FALSE BOTTOMS, PANIC SELLING ETC. IN THE GRAND SCHEME OF THINGS THEY MEAN NOTHING, BUT YOU CAN USE THEM TO POTENTIALLY FORECAST THE ACTIONS OF LARGER TIME FRAMES THAT WILL COUNT WHEN IT COMES TIME TO BUY. I CONSIDER THESE SMALLER FRAMES TO BE HEADS UP FRAMES AND CAN ALERT ME OF MICRO CONFIRMATIONS OF MY HYPOTHESIS ON LARGER FRAMES. I ALSO USE THEM TO GIVE ME AN APPROXIMATE IDEA OF TIMING ON LARGER TIME FRAMES, WHEN I NEED TO BE LOOKING AT THE COMPUTER ETC. I DO NOT BUY AND SELL WITH THESE TIME FRAMES.
FYI. BCH 3 Day Histogram has gone green.. do your own research. When in doubt draw lines..
Also the charts and diagrams come from here: https://cryptowat.ch/bitfinex/btcusd/2h
I use these as they are free and you can use them to match my setting or create your own.
My Previous Analysis:
https://steemit.com/bitcoin/@pawsdog/1-9-2017-the-market-view-and-trading-outlook
https://steemit.com/bitcoin/@pawsdog/1-8-2017-the-market-view-and-trading-outlook
https://steemit.com/bitcoin/@pawsdog/1-5-2017-the-market-view-and-trading-outlook
https://steemit.com/bitcoin/@pawsdog/1-4-2017-the-market-view-and-trading-outlook
https://steemit.com/bitcoin/@pawsdog/1-3-2017-the-market-view-and-trading-outlook
https://steemit.com/bitcoin/@pawsdog/1-2-2017-the-market-view-and-trading-outlook
https://steemit.com/bitcoin/@pawsdog/1-1-2017-the-market-view-and-trading-outlook
https://steemit.com/bitcoin/@pawsdog/12-31-2017-the-market-view-and-trading-outlook

Very Good analysis. Keep up the good work.
I'm wondering if you think the bearish scenario where it is reaching near an ATH will cause people to buy in for fear of missing out (similar to what happened when BTC broke 10k)?
I'm sure.. everyone loves to buy at the top.. lol..
Yeah I bought a false bottom two days ago. So I'm just waiting for it to go back. I find myself "stuck" lately as I dont want to trade with a loss. I would like to find the floor. I should have known that wasn't the floor, I was just being impatient. Even ripple is down significantly when I compare it to the 450 million ripple at 2.15. I'm curious about ripples low point right now.
Fact, you are always going to have to deal with loses on occassion.. it's part of the game.. What at what price and what were the charts saying.. If you find yourself stuck, just start playing small to build your confidence back up, say .25 LTC or .01 BTC trades. As the amount is so small you will find that your are able to trade without emotion, no fear of loss as LTC would have to drop $10 to cost you $2.50.. build your mojo and then slowly increase as your regain your footing and learn to trade without emotion.
it was siacoin at .08 while it was still dropping. I should have waited but I started small. I've already detached myself emotionally. As I get used to the ups and downs I will start trading bigger numbers. I've been able to sell high a few times though, so technically i'm still up from my original deposit even though I'm down from my last trade, if that makes sense.
Your not only as good as your last trade.. I lose trades all the time and am still quite profitable long term..
This setup worked perfectly. The bounce from the 50-day was sweet. Are you gunning for a specific coin at certain levels.
Which part, at what price point in which time frame? I use a 77 not a 50...
Hey, It was just a different point of view, I am using 50 day Exponential Moving Average. I meant that if you look at the 50 day EMA, you get bullish signal. It was just an add-on to you analysis. I am aware that you use different type of analysis. (tools)
Cheers !
No problem, I just wanted details so I could check it.. I love information.. If you could screen shot it and tell me your settings that would be cool. I always love to see how other people are doing things as well :)
Currently writing a small article, will post it when done. Thanks
Ok, thank you...
https://steemit.com/bitcoin/@ervinneb/bitcoin-bounces-off-50-day-ema-can-bitcoin-cash-breaks-range-ark-ready-for-top-20
I hope it is an interesting read.
Awesome Details. Really you are a trader from bones and flesh!
I start to becom a Bitcoin Picaso: #26.
Thank you, I win some I lose some... lol
I also! In the morning i buy some stuff. Then go surveying. When I come back to the office I so I'm a little fuck up but no big deal. I will solve that issue by over hodling. Funds will be locked for a few days. Just stopped me to trade!
What did you buy at what price? and what were the charts at the time?
I buy some BitShares and Steem $0.74 and $6.44. 9 and 26 MA have crossed the 90MA from the below. It's looked as it will be some up drift but turhed Fckng south!
Good lord that I earning on EOS like champ to counterweight my stupidity.
Don't stress... patience... A pullback to the 90 after a cross up is normal.. It is there to shake you out.. There is a delay to the averages, it is not instantaneous. If the crosses happened as you said, then they go up.. It happens 100 percent of the time. If you bought at the cross and not well after. When in doubt go back and look at the chart history. I bet you will have a hard time finding an upwards cross followed by downwards price. Also I'm not sure what time frame you purchased in if it was a sufficiently large time frame you should be fine... NO EMOTIONS, BE A COMPUTER
Yeah Intel inside!
Beep! Beep! This humvee will be patrolling by and assisting new veterans, retirees, and military members here on Steem. @shadow3scalpel will help by upvoting posts from a list of members maintained by @chairborne and responding to any questions replied to this comment.
thanks again and comment upvoted as always... :)
That all caps section is a great tip! I've never actually thought of it that way... I'm definitely little by little building up my store of knowledge and rules for when I'm able to day-trade.
My $707 ETH came in yesterday... can't help but smile just a little bit...
I bet, I sold of a bit early around 1200 or so.. I did o.k. as I had a limit order set on Gemini for $640 when it was $800 that I had forgotten about so that played out but I sold off a bit early on that one at $1150.. ah well.. I'm doing good though on LTC and BCH.. been snatching up the BCH dips around $2300 on GDAX and moving into more BCH over the last few days on Bittrex to hedge against BTC. I was using ETH to hedge but I'm thinking it needs a bit of time to gas as I started seeing sell indicators around $1340 and we are now entering a 4 hour selling cycle. I will see what becomes of it. If it trends up during the sell, I may get back in.. but no ETH at the moment and all BCH as a hedge against BTC on bittrex at the moment, plus 15 or so alts that I like..
Like you always say... money can't be in two places at the same time... which also applies to your money... clearly LTC and BCH are gearing up for a rise while BTC mucks around and ETH is enjoying the highs... temporarily.
I still have never bought BCH... for so long I saw it as a dodgy get-rich-quick scheme designed to steal from my BTC holdings... I really need to get over those emotions.
Objectively speaking it is technologically superior to BTC. Assuming that it is BTC but a superior product, it sure looks to be underpriced at the current $2500 level. Also oddly, I have not forgotten my conspiracy theory flippining idea either. The weekly on BTC may go Uggg, which would be bearish as BCH goes on a run toward 7k plus.. bringing the two dangerously close together in terms of price. At which point a changing of the guard would not be so out of the question. Again pure conspiracy at the moment.. LTC seems to be in phase with BTC right now, whereas ETH is not. LTC is slowly gaining ground on the LTC/BTC pair a sign of strength and usually indicative of a run up at some point, but not seeing it in the super short term. That is why I started moving to BCH 2 days ago, go to the charts and look at the BCH/BTC pairings, especially last night.. You saw that BCH was accepting the gains on BTC but shaking off the losses and it was gaining ground. That said BCH is finkle and loves to go to 2700 then down to 2300 again.. so I'm watching it as it is a sneaky fucker at times...
Knowledge is a key to success!
If you knowlidgeble don't miss my TFDSRE series: #1, #2, #3. Here is also my last analysis #26, glad to get a comment from you, to hear your opinion.
Great rating.
.gif)
Thanks.... :)
welcome
Nice post!
I'm trying to develop a game with bitcoin/hacking theme by myself. If you like, have a look at: https://steemit.com/gaming/@sn0w-fox/bitcoin-hacker-game-uplink-hacker-elite
PS: I like your avatar
Thank you and add more meaningful comments in the future please before advertising.. thanks again..
Day 3 of the 10 day down turn.
Maybe so.. No clear trend in sight, save the larger frames are bearish and folks are losing money playing pick the bottom. But we need this in the grand scheme of things.. just have to see where it ends up..
Get your post resteemed over 90000+ followers and get upto $19+ value Upvote. Your post will skyrocket and give you maximum exposer.
See our all pakages at: www(dot)whaleboostup(dot)ml
get this garbage out of here.. i hate vote selling..i will downvote this.. exposer? lol.. i will pass
Ex-Poser: A Person that is not a poser anymore