1/9/2017 The Market View and Trading Outlook
BTC, still doing nothing of interest.
It is times like this that many traders slowly watch their capital get eaten away piece by piece as they play “pick the bottom” and buy false reversals.
As is many times the case with BTC we are on the verge of going up or going down with no clear trend upwards or downwards in sight. For the most part BTC is holding at the longer term averages on the 4 and 6 hour time frames although price has broken below the 77 on the 12 hour and all time frames are below the longer term moving averages.
So let’s get to it
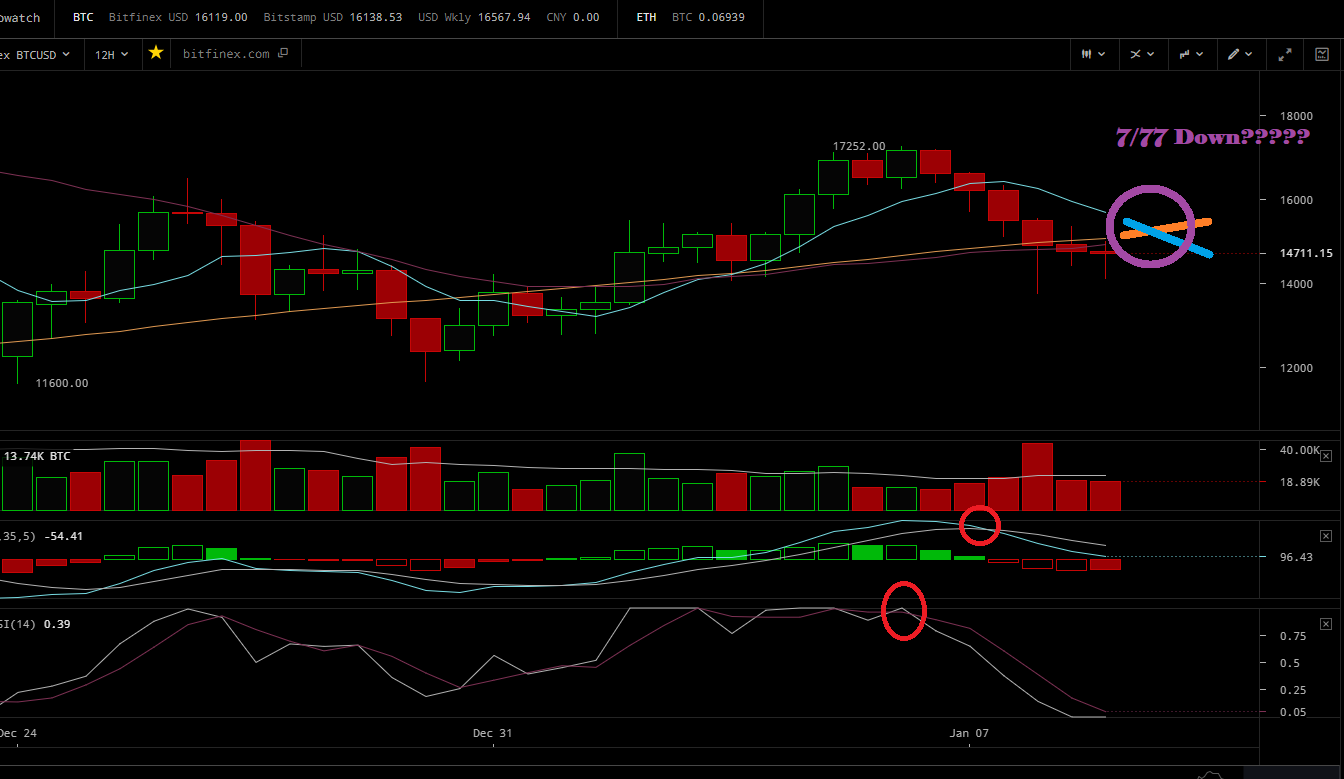
On the 12 hour things are neutral “for the moment”, this opinion being based upon the fact that selling action has slowed somewhat and we have our first solid bar on the MACD histogram. Will this be the beginning of the end for this selling period? Not sure, as the 1 day is now in a selling cycle as well. The bearish indicators for this time frame are that price is now below the 77 period moving average of $15,100 at $14,700. The longer it stays here the more bearish momentum will be gained by the shorter term 7 period moving average which could lead to a 7/77 downwards cross; very bearish and a solid indication of significant future losses. We also have 2 of 3 sell indicators; we had an RSI cross at $17,200 and an MACD/Signal line cross at $16,300. Bullish indicators for this time frame are that selling action may be slowing, we have MACD signal line divergence to the downside and are still above the MACD 0. I can’t really make a solid call based simply on this time frame, save I would be more bearish as the 1D and 3d are still actively in selling frames.
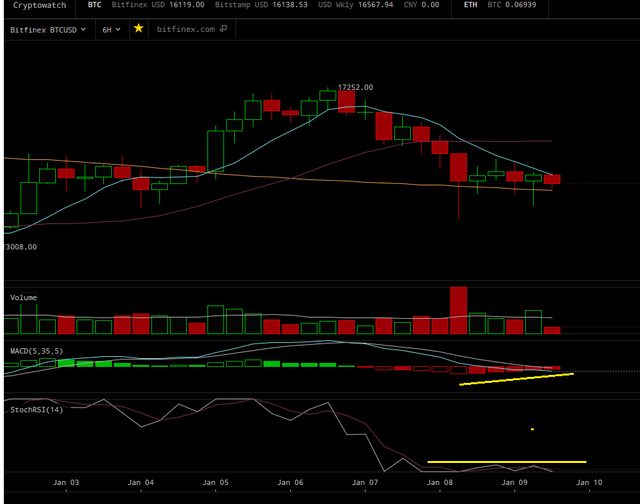
The 6 hour, again neutral as we appear to be exiting this selling period according to the MACD histogram. Price has remained above the longer term moving average thus far and seems for the moment at least to be content slowly riding it down. We do have the 7 period moving average coming down like a dagger that may very well pierce south of the 77 and bring some losses with it, it may also slide in just above the 77 without breaking it. We are below the MACD 0 line, however we are entering oversold territory that coincides with the lessening sales volume and decreasing MACD histogram. Most likely we will have a somewhat anemic follow on selling period or buying period as the 12 hr, 1 day and 3 day remain in the red. If we do get an follow on buying period the 21 period moving average sits at $15,900 and will serve as key resistance or a place to sell if the trend reverses yet again. I’m not seeing a time to buy at the moment and will continue to wait it out.
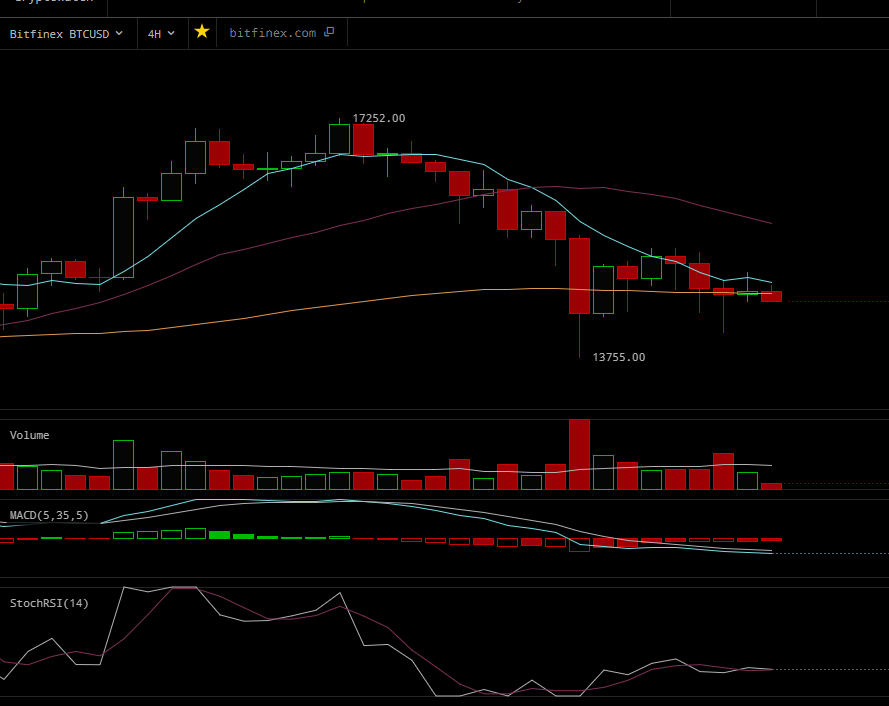
The four is basically the exact same story as the 6 hour time frame. We are below MACD 0, the 7 came down and has of yet not broken the 77, price is riding the longer term moving average, we may be closing the period out according to the MACD histogram, oversold etc. Still nothing of note here that inclines me to buy as I have no clear reversal of trend.
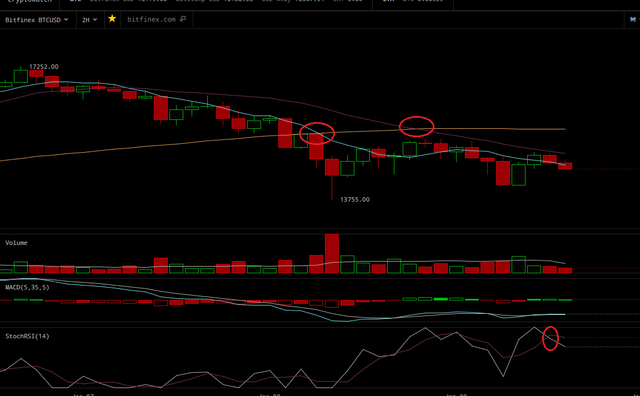
The two hour is just as ugly as it was yesterday, if not more so. The 21 broke beneath the 77 and price followed. We now have about as many bearish indicators as you can get on one chart. The 7 is below the 21 with price riding the between the two, both of which are under the 77. Price is having a difficult time breaking above the mid term moving average and seems to be slowly sinking with each passing candle. The RSI has us in overbought territory and there has been an RSI crossover to the downside, MACD histogram shows this buying period is about to end, MACD is below 0, Volume is unremarkable etc.. bear, bear, bear… This time frame most certainly does not incline me to buy and I will wait it out. NO FOMO..
The 1 hour and even as low as the 30 minute tell the same story. Price and mid/short level averages below the longer term, trending down etc. No need to go into detail here. It’s wait and see at the moment with potential hope in the larger time frames meaning late tonight or early tomorrow but this evening is looking pretty bleak. Accordingly I’m going to go hang out with the family for a bit.
Ethereum @ $1246
Most likely reaching a short term top in the near future. It seems to be a good store of value against BTC right now. If BTC takes off then expect ETH to sell off to some extent. Looking at the longer term moving averages I think I will wait and see if I can buy it again at $950 or lower; probably closer to $834. Price will always come back to the longer term trend lines, it always does in 100 percent of cases. Where that happens is the hard part to figure out. It may be higher, if ETH goes to $1500 as I said a few weeks ago then I will adjust accordingly, but I'm must not feeling it now as I know I can get it cheaper later. In fact if your feeling a bit risky you can pretty much guarantee a fill at $1050 in the not so distant future. Again I may be wrong, things change by the hour.
Litecoin @ $248.
Move along nothing to see here. LiteCoin is in phase with BTC at the moment so what BTC does Litecoin will do. That said I have started collecting here and there in the low to mid $230's. I set my buy at $235.50 get 75 or so, sell 2/3 at $250, rebuy in the $230's etc. Locking in profit and starting a small collection to sell at a later date.
My Previous Analysis:
https://steemit.com/bitcoin/@pawsdog/1-8-2017-the-market-view-and-trading-outlook
https://steemit.com/bitcoin/@pawsdog/1-5-2017-the-market-view-and-trading-outlook
https://steemit.com/bitcoin/@pawsdog/1-4-2017-the-market-view-and-trading-outlook
https://steemit.com/bitcoin/@pawsdog/1-3-2017-the-market-view-and-trading-outlook
https://steemit.com/bitcoin/@pawsdog/1-2-2017-the-market-view-and-trading-outlook
https://steemit.com/bitcoin/@pawsdog/1-1-2017-the-market-view-and-trading-outlook
https://steemit.com/bitcoin/@pawsdog/12-31-2017-the-market-view-and-trading-outlook

Do you trade exclusively the major coins, or you are trade other ( not so well known) coins as well.
Also maybe if you can make your cahrts zoomable, it will be easier for us. ( for example link your photo to the original photo, so we can see) I personally have trouble seeing the crosses. Good work overall, extented analysis.
Also like a tip I can say that - maybe a small sum up in the end for BTC would be nice, although I enjoy reading the whole stuff. You are the first trader I see to use the hourly charts that much.
Cheers
The charts I use for these posts are here.. https://cryptowat.ch/bitfinex/bchusd/1h set your SMA to 7/21/77
I do sum it up most times, but do so in the beginning. Not much to say really as we are still doing basically what we were doing yesterday. Additionally I posted last night in regards to the charts as well and FOMO.
I use the various time frames as I trade throughout the day.. I am pretty much the opposite of a HoDler... Even if the market is declining I will find buy points here and there. I also make a great sum of $$$ shorting BTC on the bigger downtrends through Kraken.. but I do not cover shorts here as that is not something I want anyone to get involved in until the figure it out for themselves.. Especially short/long with margin, as those can kill an inexperienced trader quickly. Thank you for the comment.. I don't think I can make them zoomable.. you would have to do that with the link I provided.
Also I trade other coins on Bittrex as well. I just do not do analysis on them here.. nor do I give recommendations on them. In the comments sometimes I may mention one that I am in or not in at any specific time..
I am very interested in your day trading. I am a day trader myself, but I trade equities. I shorted once BTC on Kraken, then I couldn't enter KRAKEN for 12 hours or so, lost a hefty amount. Since then I don't trade on kraken. I would be pretty happy if we can connect on telegram for example and share info.
Thanks for the answer
@pawsdog I think that is enough of this ranging Bitcoin market. We should be patient and watch chart carefully to spot the sweet point to buy in.
p.s. My work of past few months to be shared with All Steemians please resteem and let it be of great use TFDSRE: #1, #2, #3.
I like it I read it and resteemed it.. I like how you explained it..
Thanks, I must write another two articles or chapters to complete this series, but for tomorrow i have full schedule in my business. Have to go do some land surveying. So tight with time.
Well let me know when you put them out and I'll be happy to check them out... :)