New Invention Tombort-Fibonacci Dynamic Support-resistant Equipotentials - Moving Averages (#1)
Introduction to TFDSRE - Movine averages
In the next five blogs I will present you a new revolutionary technical analysis tools combination which is my invention and I perfect it in last two months since I announce this series of blogs on Steemit 2 months ago #.
This invention is called Tombort-Fibonacci dynamic support-resistant equipotentials. Past two months I was intensively developing this set of TA tools and now is the time to present them to you my dear Steemians.
So stay tuned and start profiting whit this set of tools with me. Please resteem this pages to your followers because they are your faithful mates and they deserve to get this information too. We are a big community and we have to support each other. I invite you to join my initiative For Better Steemit #1, #2, #3, #4 which was inspired with my article: Upvote Myself no More and become Steemians from the Good side.
Moving averages
Moving average is very simple system to condense information from the past and present it at the current frame on the price chart. It was one of first inventions traders and analyst start to use in the beginning of 20-eth century.
We calculate it to take last n price frames and divide it with the number of frames we have took into account.
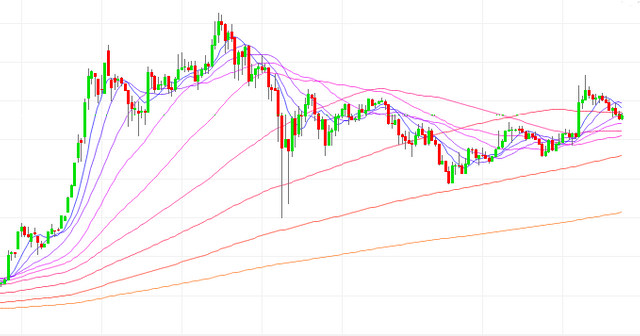
Frame or period is time window in which trading is conducted. On charts we can plot average price, open price, close price.... of one period or frame. Japanese candlesticks represent open, close minimal and maximal price in particular frame. Open price is upper boundary of candle in bearish (read) candles and lower boundary of the bullish candle (green). Close price is lower boundary of bearish candle and upper boundary of bullish candle. Upper and lower wicks represent maximal and minimal price.

Figure 1. Moving averages on candlestick chart.
Almost every trader(1) use this simple tools for analyzing price movements on charts. Crossings of moving averages can be used for simple and quite powerful trading strategy, especially when they are combined with some other indicators. Most common combination is moving averages with MACD and RSI oscillator indicators. This strategy maybe will be discussed in some separate articles. Here we will concentrate on moving averages.
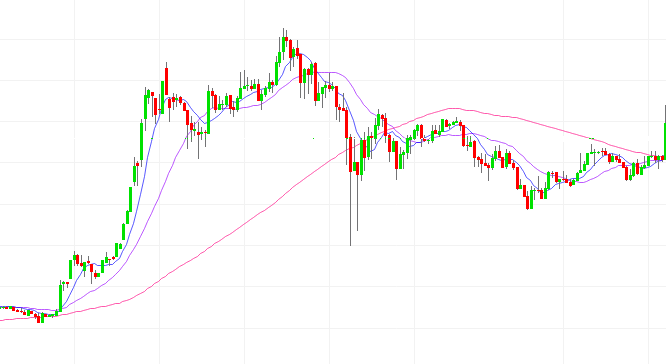
If we use a combination of averages for 9, 26, 90 frames we can deduce quite a lot of information from price chard.

Figure 2. 9, 26, 90 frames combination of moving averages
Slower (2) average is used to predict trend and faster two are used to define buy and sell points on price chart.

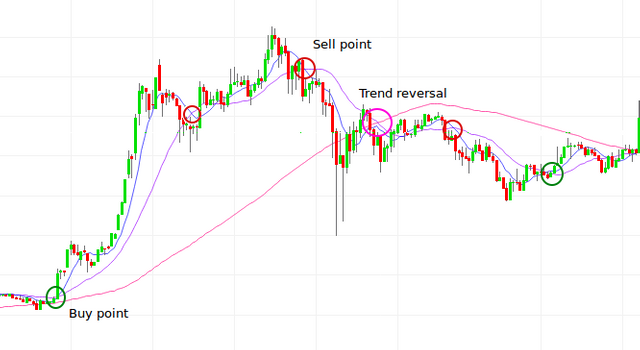
Figure 3. Crossings in red circles are sell points and in green circles are buy points. Purple circle mark reversal of trend.
Simple trading strategy consist from using crossings of 9 frames and 26 frames moving averages as buy and sell points.
When 9 frame average crosses 26 frame average from above we have sell point and opposite is valid for crossing 9 frame average of 26 frame average from bellow. It later case have buy point on chart.
When 9 and 26 frame averages crosses the slowest 90 frame average a trend reversal is occurring and we have adopt our positions accordingly.
This is all about simple moving averages. In the next article we will discuss Fibonacci levels and proportions.
Remarks:
1. @pawsdog is one of my mates here on Steemit who use moving averages in his analyses extensively. Check his blog for details.
2.Average with more frames is called slower and with less frames it called faster moving average. Slower averages trace the price more loosely and can be used for trend prediction on charts. If price is above slower average we have an uptrend and opposite is true for price under moving average.
Image sources: pixabay.com, investing.com
Disclaimer: If you use my ideas and analyses in your investment ventures, you take all responsibility and consequences about your actions.
And as always upvote this post and previous ones, if it have some value,follow me, if you think this content is great and I promise that it will be more interesting stuff in the future.

If Your are trying new trading setups, look at 20, 60, 120 frames. This setup crypto-people use in Ichimoku (20, 60, 120, 30). They give cleaner and more probable entries. From my view bitcoin market and others respect the lines pretty good!
Wait for next articles I divide my work into five parts and it's really some thing special. I will post an article every day so stay tuned!
I must also thank you to be my devoted follower and upvote my articles. Thakns!
I also downloaded steem-python library and start to investigate the code. There is no much documentation. I see you programming also. I'm interested in cooperation somehow.
I will setup my chart and see!