Bitcoin analysis. Bitcoin Uptrend Potential (#26)

Lately many Crypters are concerned about all kind of FUD about Bitcoin, But Bitcoin is doing great, has nice uptrend potential.

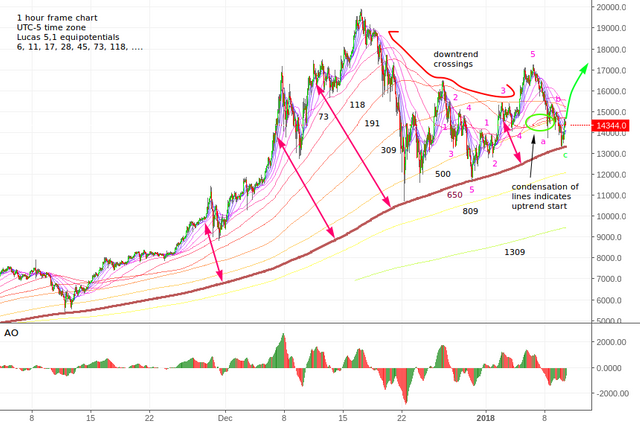
I feel like I get an order to explain technical analysis to fifth grade guys to actually understand it. Very tough mission. But with looking on moving averages as equipotential lines start to become viable. On chart above anyone can see that price is fare away from base line started on Segwit2x dip in November. This intuitively speaks to us and i actually real fact. From that dip to last all times height Bitcoin price was like bulldozer. Any body will agree with that statement.
And when a price was crushing down and naysayers start to whistle "It's a Bubble bursting!", you have to just show them this chart and ask them why this lines still going up despite price is crashing as you say. And this naysayers will start thinking: "Maybe this Bitcoin thing is something? ...".
An when point them out that a double bottom is forming and that this is a sign of reversal and end of correction. They will say: "Yeah, je, this lines going up man, it's a correction and this Bitcoin thing is really a thing, man!"
So my dead Crypters the citizens of the crypto world. HODL! Hodl rocks! naysayers will also hodle ones. And by the way it's a nice entry point now. Jump in now to avoid FOMO headaches.
Don't forget to check out this new TFDSRE thing and fuck the haejin's waves! You can't surf on them: #1, #2, #3.
Previous analysis: #21, #22, #23, #24, #25. Is good to check them out to get insight into my reasoning.
Image sources: Investing.com,
Data sources: Bitfinex exchange
Disclaimer: If you use my ideas and analyses in your investment ventures, you take all responsibility and consequences about your actions.
What do you think about BTC price? Comment and present your views! Great ideas emerge from good quality discussion! I'll be immensely grateful for your contribution.
Check also technical analyses from TAF squad: @pawsdog, @futuristgear, @exxodus, @allthereisislove, @lordoftruth, @ew-and-patterns, @toofasteddie, @gazur.
And as always upvote this post and previous ones, if it have some value, follow me, if you think this content is great and I promise that it will be more interesting stuff in the future. Let steem on, to the bright future!
I love the "topographic map" appearance of your chart analysis. Very original and interesting idea. I am also very bullish on Bitcoin right now. I predicted yesterday that the price should touch $12800, but not stay there before continuing the reverse head and shoulders pattern. Then it did just that, and now I am looking forward to seeing what Bitcoin does today. No guarantees, but odds are in our favor.
Excellent article as always... I like how we get to the same point with different methods in most cases...
Yeah that is really awesome!