2/2/2018 The Market View and Trading Outlook
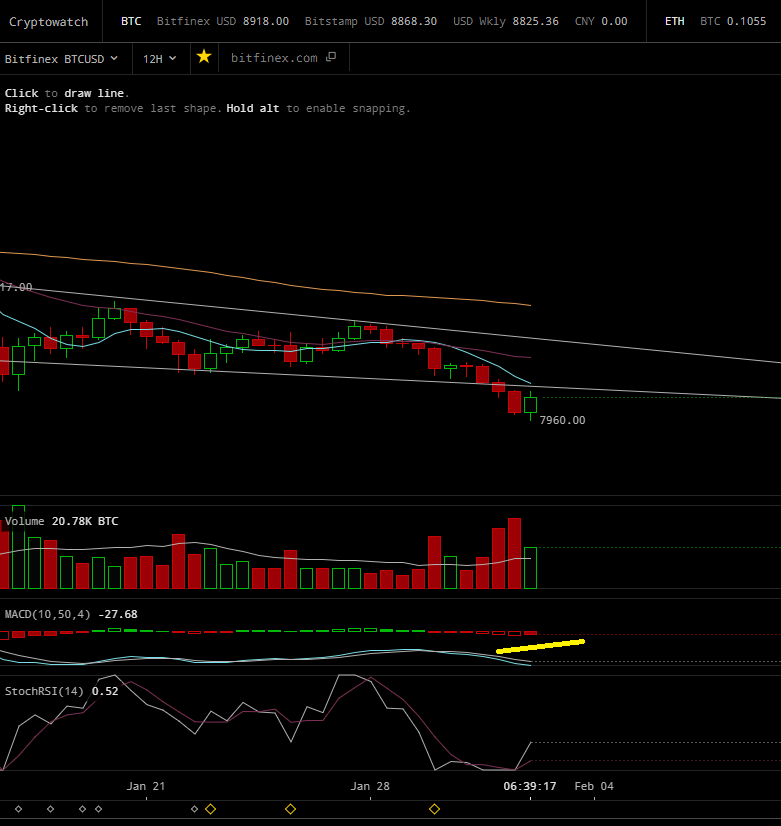
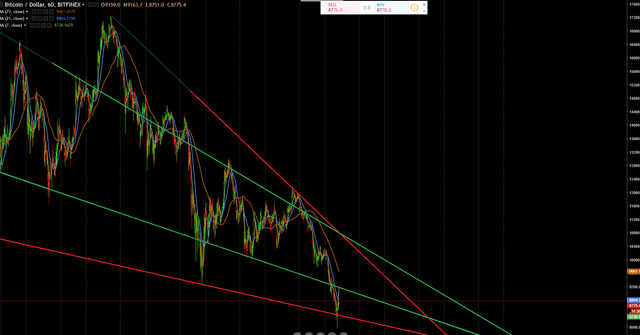
Not a bad bounce near the 3 day 77 period moving average of $7200. Is the bottom in? I doubt it..and I expect at least 1 more lower low lies on the horizon. That said, don’t expect it today or tomorrow as we breached the lower boundary of the descending wedge and will most likely make a run for the upper boundary of it before we face rejection once more. In the “short term” things are looking good and if we can decisively break $9200 we could make a run for somewhere in the neighborhood of $9800 or $10,200 before faltering again in favor of a lower low that pierces the $7000 decisively. I am somewhat indecisive on the pattern at the moment as my charts seem to be acting up. The market is choppy and caution is the proper course of action for the moment as the chance of violent reversal to the downside is ever present.
Onto the charts.
On the 12 I can’t really make a definitive call, though I’m leaning more towards a potentially “short term” bullish scenario; bull trap possibly? This call is based solely in the indicators. The MACD Histogram has its first solid bar since the start of the decline at $11,000 meaning that selling may be slowing to some degree and a short term buying period may be on the horizon. RSI has us coming out of an oversold condition though I don’t feel we spent enough time there and this bounce may simply be a reactionary high and bull trap.
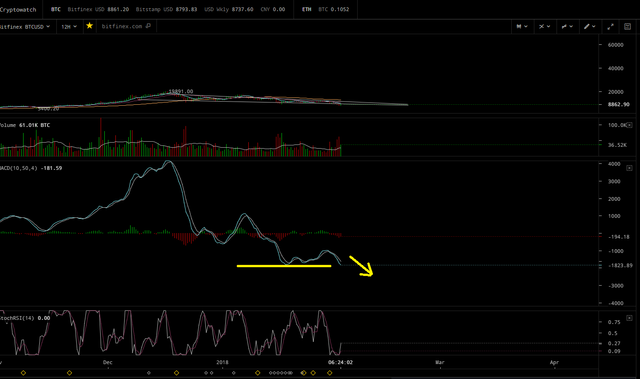
The MACD/Signal line combo is still pointing decisively to the downside and on the way to making a lower low, while price is rebounding. As the price and the MACD are not in agreement for the moment it makes me question the validity of the upwards move.
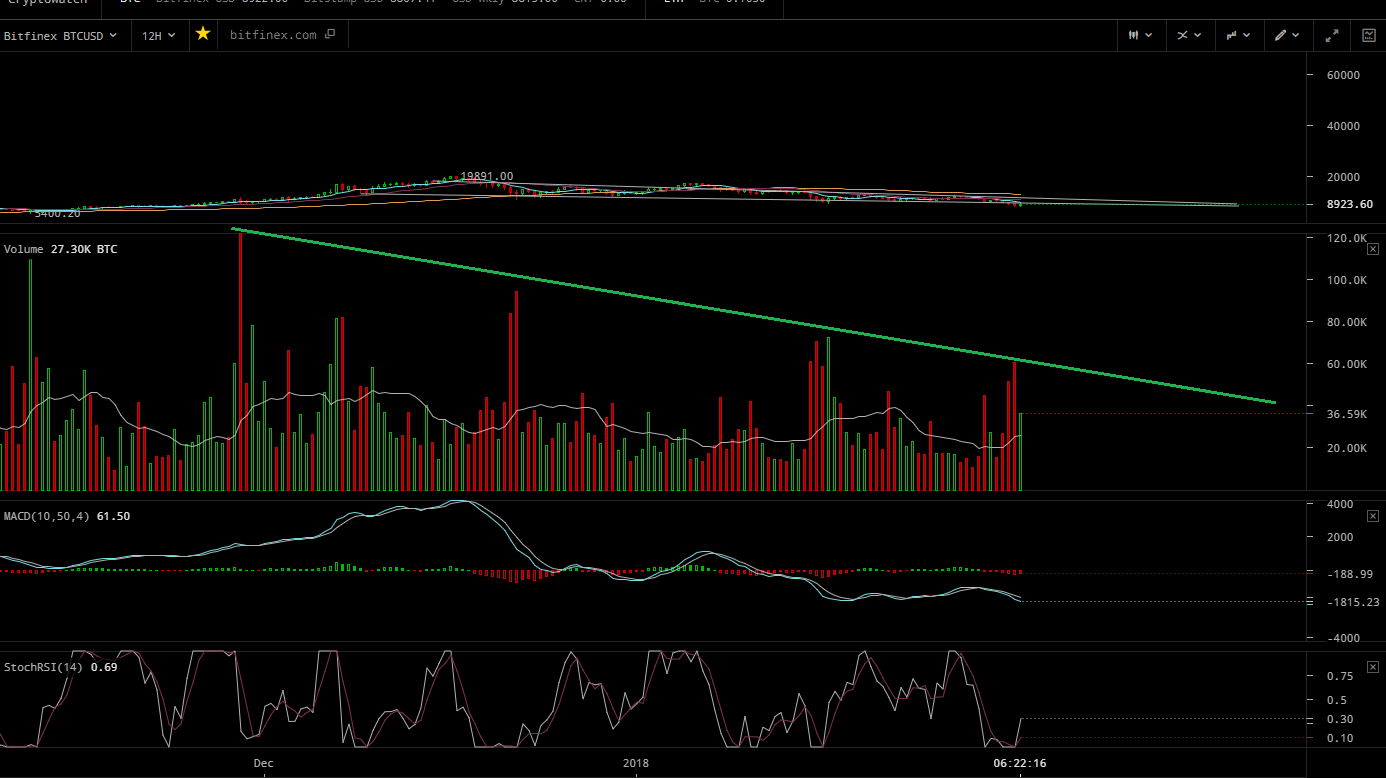
Volume is still declining steadily in the longer term as is expected, but it should dwindle to trickle as we get closer to the end of the correction; that being the last of the Hodlers and weak hands giving in to downwards pressure. Currently volume is not showing that we have reached the end or the bottom.
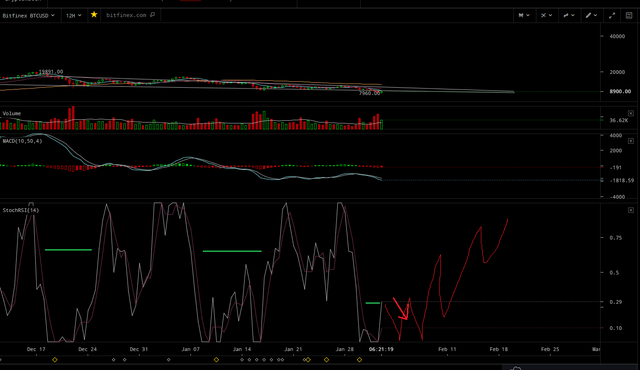
If we look at the RSI, the bounce seems a bit quick when compared to historic performance. Notice the spacing (green lines) between previous oversold and overbought conditions and compare that to the current bounce; seems a bit suspect. Accordingly I see us getting jerked around a bit more; my scribble is the more likely scenario.
As I stated here: https://steemit.com/bitcoin/@pawsdog/1-31-2017-the-market-view-and-trading-outlook-actual-info Technical analysis is a pseudo science and much depends upon an individual’s subjective interpretation of the data. As a result when charting patterns the locations each person chooses to draw their lines can impact their interpretation of the data. I may draw my lines in one place and someone else may choose another; though we may be in agreement on the greater trend we may differ in opinion as to support and resistance levels. In looking objectively at the 12 we are either within the bottom boundary of the descending wedge having briefly fallen through or we are have decisively breached the bottom, attempting to get back in and headed for much lower territory.
Looking at the chart on tradeview, the descending wedge for @heajin would be red, whereas I would be green. So from his perspective we may have touched the lower boundary and are back inside moving towards the upper boundary somewhere around $9600. For me, being a bit more pessimistic, we could have broken below the lower boundary and are working to get back inside.
My rendition provides for a considerable amount of resistance at $9150; a likely rejection and only if that can be decisively broken would we move towards the upper boundary of what I have as around $9700 before we face rejection in favor of a likely sub $7000 low, likely in the $5000’s by the time it is all said in done in a couple weeks. It’s subjective, look at all information from all sources and make your own decisions.
As I’m making .85 percent of $3.00 USD for these posts I’m likely going to shorten up in the near future. Probably a pic of a chart, a short paragraph about upcoming orgasmic lunges and price ejaculation and let that be that as it seems to be a winning formula. That said I will probably post 10 or so of them per day.
Intraday a pullback to around $8500 from $9100 would be fairly normal and a 50% fib from $7900 to $9200, though $8380-ish may be the lower boundary of a bull wick on a flash sale and retracement towards making future gains if we stay bullish. May not pan out, or it may.. I keep options on the table.
My Previous Analysis:
https://steemit.com/bitcoin/@pawsdog/2-1-2018-the-market-view-and-trading-outlook
https://steemit.com/bitcoin/@pawsdog/1-31-2017-the-market-view-and-trading-outlook-actual-info
https://steemit.com/bitcoin/@pawsdog/1-30-2017-the-market-view-and-trading-outlook-actual-info
https://steemit.com/bitcoin/@pawsdog/1-29-2017-the-market-view-and-trading-outlook
https://steemit.com/bitcoin/@pawsdog/1-27-2017-the-market-view-and-trading-outlook
https://steemit.com/bitcoin/@pawsdog/1-26-2017-the-market-view-and-trading-outlook
https://steemit.com/bitcoin/@pawsdog/1-25-2017-the-market-view-and-trading-outlook
https://steemit.com/bitcoin/@pawsdog/1-24-2017-the-market-view-and-trading-outlook


Pawsdog you are very right about TA been pseudo science. I make a snapshot post with link to yours to put this subject out there for others also.
Check it here @.
Firsly I would like to say - Don't Stop Making These analysis. The low payout is surely not pleasant for the work you are putting in, but this analysis keeps you sharp ! The small things prepare us for great results ! You wont make 500$ from this post, but you will be ready when the opportunity comes.
As for the charts, unfortunately in my last analysis (as I am doing them from home) the 200 MA is missing. Can you guess where the 200 MA is - YES, it's exactly at 8009$. This is kind of a bullish indicator. BUT I think it is very uncertain at the moment the whole picutre. First test will be at 9200, next one at around 10,300. I think we might see some ranging in the upcoming days/weeks. Range between 8 - 10,500 seems pretty legit for me.
Summary: Short -Term Bearish
Good take on it.. I mostly agree.. I think 9100 will be a solid battle but one we will breach, from there we have to fight through longer term MA's 9500 on the 77 1 hour, which is also close to the 4 hour 21, and 10500 on the 77 2hr.. right now we are fighting the 2 hour 21 and will most likely breach it and fail somewhere just over or just under $10,000.. to early to tell.. objectively I have to go short term bull to your bear based on a possibly up trending 12 hour histogram.. again to early to tell.. if it goes green we get $1000 to $1500. which may push high 10,000's.. Its early so I'm still undecided longer range.. but I will hold my short term bullish view (say next 36 hours or so)... That said I'm still not buying yet as I have no clear buy point and it may turn south.. maybe if we get a solid turn on the the 4 hour I may test the waters...
I am still short-term bear, we might sweeten the pot with a little 1 SBD bet on it :). I might even go some short, if I see a good entry point. But a little, just to put my money where my mouth is. Thanks for your hard work on this post :) We all appreciate it :P
Whats the time frame? 12 hrs, 24 hrs.. 1 SBD is fine.. once we clarify the parameters...I'm an intraday guy so we have to clarify what we both feel is short term..
Next 12 H ? If it is 8890 or above (todays close) you win 1 SBD, it it's under that I win :)?
18 hours and I'll take it.. I don't want to eat the tail end of nightly price action.. So around 2 p.m. EST tomorrow.. Good?
Its around 8 p.m. now..
Good :) If you someone is OFF with more than 1000 $ double it ?
Deal.. 1000 is a big number, but why not.. I think I will be foolish and go bull against the bear in a confirmed bear market.. See if I still have some "intuition" left from this morning..
I appreciate the biting sarcasm, it always cheers me up to see! Makes me feel all warm and fuzzy inside, like I'm home.
Then I shall keep it up... :)
Beep!Beep! @shadow3scalpel & listkeeper @chairborne have your six new veterans, retirees and military members on STEEM. We’ll be patrolling by to upvote your posts (because you are on the list) and we'll answer any questions you leave us. Comment by @shadowspub. This is a opt-in bot.
Do the @heajin Method of Rich Rewards From STEEM?
Lol, you picked up on my sarcasm..Yeah that does seem to be the successful business model.. I just need a whale that I can jerk off and get constant upvotes from.. Happens all the time here.. In fact I think his model was spreading for a bit.. This one was just getting started.. https://steemit.com/@travelingsomm tailed off after I starting blowing up the comments section, but likely temporary and it will kick off again I'm sure...
I see trevonjb is her Whale Patron.

kpine as well..
So, no need to harass her.
She's on a whale circle jerk and since trevon gives to bernie, nothing will happen.
Just remember, bernie runs an upvote whale, so he's just as much at fault as the rest. No upvoting thru the API, no abuse.
True, that is just the way it works... haves and have nots... lol..
wonderful post
Thank you...
Haejins secret is certainty. it may be fake but nevertheless people desperately need some "authority" to tell them what will happen next.
Certainty... lol.. in an uncertain market... I see his "certain" call on SBD to be $29 in the near term missed the mark by a small margin...
https://steemit.com/sbd/@haejin/steem-dollar-sbd-readying-to-explode-target-usd21-95-or-higher
https://steemit.com/steemdollar/@haejin/steem-vs-sbd-do-not-underestimate-sbd
Of course he can and will "certainly" just issue a new proclamation he can be right about...
https://steemit.com/sbd/@haejin/sbd-will-it-go-to-usd1