1/31/2018 The Market View and Trading Outlook (actual info)
And yet another day of corrective price action has passed. So where are we, whats the forecast are and what will price do from here? All good questions, however there are no clear answers. The market for the moment is mostly scared with a dash of hopeful thrown in for flavor.
I think (again my opinion) that utter failure of the $10,000 will more than likely be the reality in the near term. The question then becomes where is the bottom? In trying to answer that everyone has their own method be it Elliot Wave, use of Indicators, Fibonacci or discernment of Chart Patterns. There is “NO” be all end all method of price prediction, all you can do as a trader is to examine all the possibilities based on current market behavior, narrow those down into a handful of probabilities, and further narrow those down to the most likely price path ways based upon the totality of all available information.
Technical Analysis is an extraordinarily subjective pseudo science when it comes to determining the most probable price direction of the asset you are scrutinizing. Add to that, the fact that bots now exist with the sole purpose of examining known chart patterns allowing the set up to present itself and swinging price in the opposite direction to trap traders in the shorter time frames.
I really don’t have a ton of information to add for today save I do believe we are likely still heading south to an as of yet undetermined bottom that will likely rest on one of the longer term moving averages of the 3 day or weekly time frames.
To that end the next major support area is the 1 week 21 period moving average at $9400 and from there the 3 day 77 period moving average at $7199. In attempting to “feel out the market” I think there is still too much hope around for us to have truly entered the capitulation phase where everyone throws in the towel and recovery can begin.
I hate to re-gift information from my previous analysis but on occasion it continually pops up as relevant so in regards to capitulation the below is sourced from my previous analysis here: https://steemit.com/bitcoin/@pawsdog/1-22-2017-the-market-view-and-trading-outlook
As you cannot determine capitulation until it after the fact I doubt we are there yet as selling volume is not epic at the moment and belays hope by HODLers of a quick turn around.
We may still be in the denial phase to some extent. A good explanation can be found here:
Eventually the market tops out well below its previous high and starts a new downleg carrying it to lower lows. During this phase the fundamental news significantly worsens and investors realize that that a bear market is in force. This is the phase of concern. During this phase many investors sell, but others hang in, feeling that the bad news is discounted and that a bottom is near.
At this point the market may rally again as many observers feel that the decline has ended and that a new bull market has begun. This rally, also characterized by weak breadth and low volume, subsequently fails and heads down. --(hmmm, failed rally, heading down.. sounds vaguely familiar?--@pawsdog)
At this point the majority becomes exceedingly bearish and throws in the towel, fearful of further declines and the potential disappearance of their assets. This is the capitulation phase, when stocks are sold on fear and emotion rather than on rational analysis. It is at that point that the market is finally ready to make an important bottom.
And here is a solid short answer:
Capitulations are outcomes that result from the maximum psychological and financial pain that can be endured by a group before throwing in the towel.
Source: https://www.investopedia.com/terms/c/capitulation.asp
So the question is how much pain can you take before throwing in the towel? If you are already out and sitting in cash then you have nothing to worry about.
So to the charts:
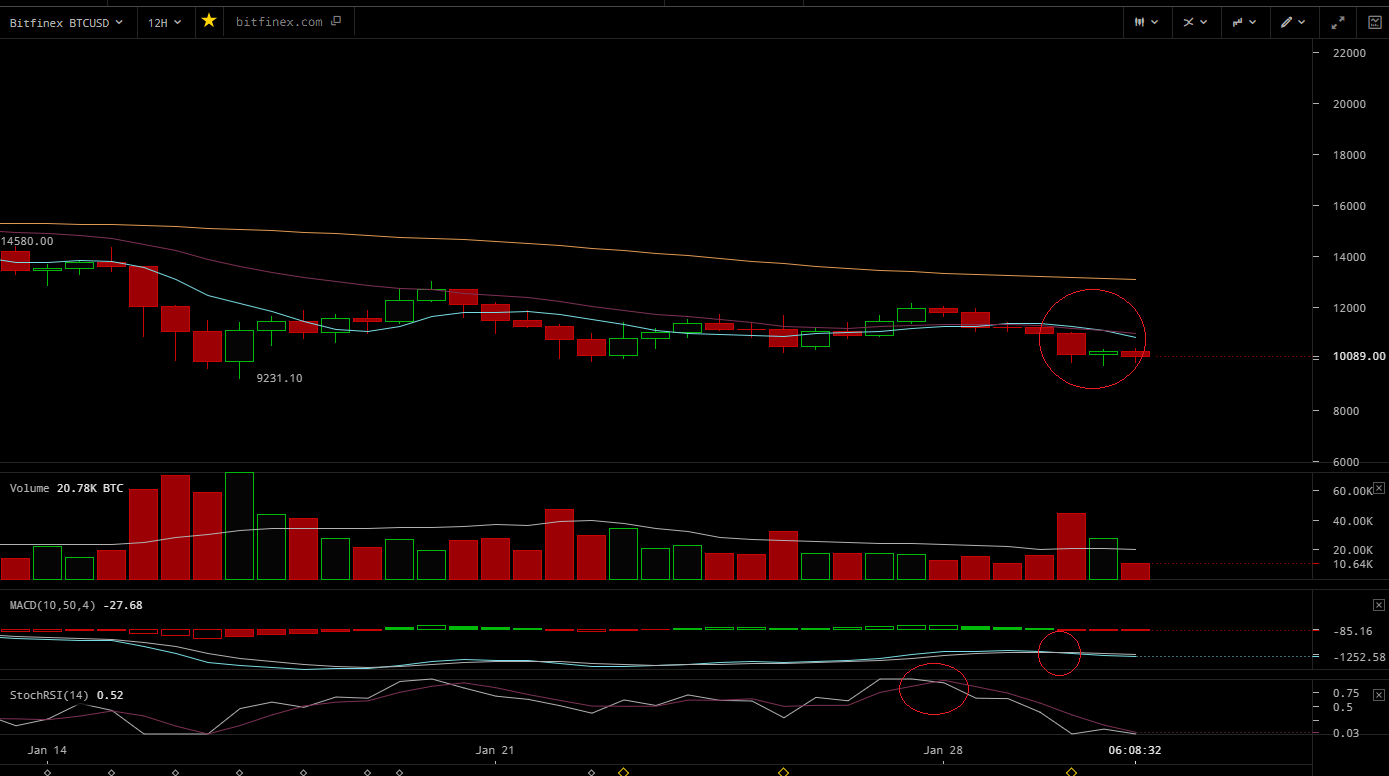
The 12 hour is saying to sit it out, and wait. We have 3 of 3 sell indicators at the moment, the most concerning for me is the 7/21 downwards MA cross that just occurred and which will likely bring about some impressive declines. The RSI is declining after a crossover to the downside, the MACD/Signal line has crossed to the downside and there is considerably more resistance than support at the moment. That said, I’m not going to do much save possibly trade the smaller frames with small amounts I’m willing to lose as the greater trend is still somewhat bleak.
No real need to go into the other time frames at the moment, even the hourly is looking pretty shitty in the grand scheme of things and is likely about to do a 7/21 downwards cross of its own which will push us back into the mid $9000’s. So again I’m just not seeing anything that inclines me to get risky and start chewing through my capital.
Lastly, there is this big deal about the 4 hour chart and the current declining wedge pattern. As I stated TA is a subjective pseudo science and as a pseudo practitioner of this pseudo science I’m not loving where some are putting their lines.
That said I’m not trying to start a flag war or some other childish Steemit Bullshit; I’m stating that I disagree with the pattern apex as presented by @haejin. Moreover, I find it to be somewhat irresponsible to attach a time stamp to the bottom. Here is the pattern presented by @haejin.
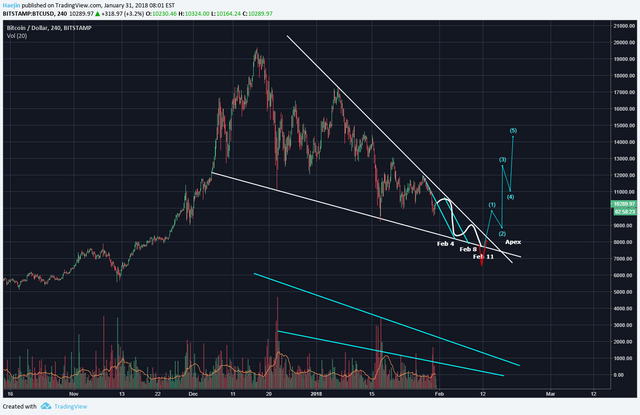
I cannot get on board with conveniently moving the upper falling wedge resistance line to suit your predictions. The name of the game when trying to draw patterns on a chart is to connect as many highs and as many lows as you can with a straight line and discern what is relevant and what is not. @haejin is using the high of $17,000 as the start point for the pattern, which creates and extremely steep wedge and fails to justify the majority of price rejections that have occurred since that time.
Also that high, like the one at $19,000 occurred on mediocre volume at best (red circles); as neither have volume confirmation, they are nothing more than noise, anomalies, one off’s and not relevant to the overall structure of the pattern. His lines (white) connect 2 low volume highs with 2 extended wick bottoms which I don’t agree with.
.png)
Accordingly I have redrawn the lines (red) in a way that they now justify the majority of the price rejections, have volume confirmation, discount low volume high price anomalies and connect the higher volume highs with the upper boundary of the falling wedge. In this scenario, the correction may drag out a bit longer than the time frame presented by @haejin.
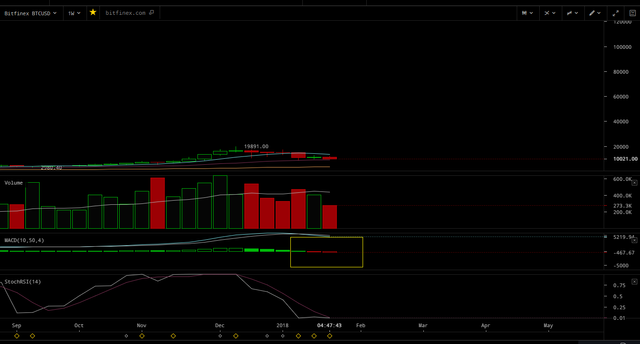
It would also correspond better with the weekly MACD that currently has us 2 bars into a selling period that averages 4 or more (yellow square) as seen below.
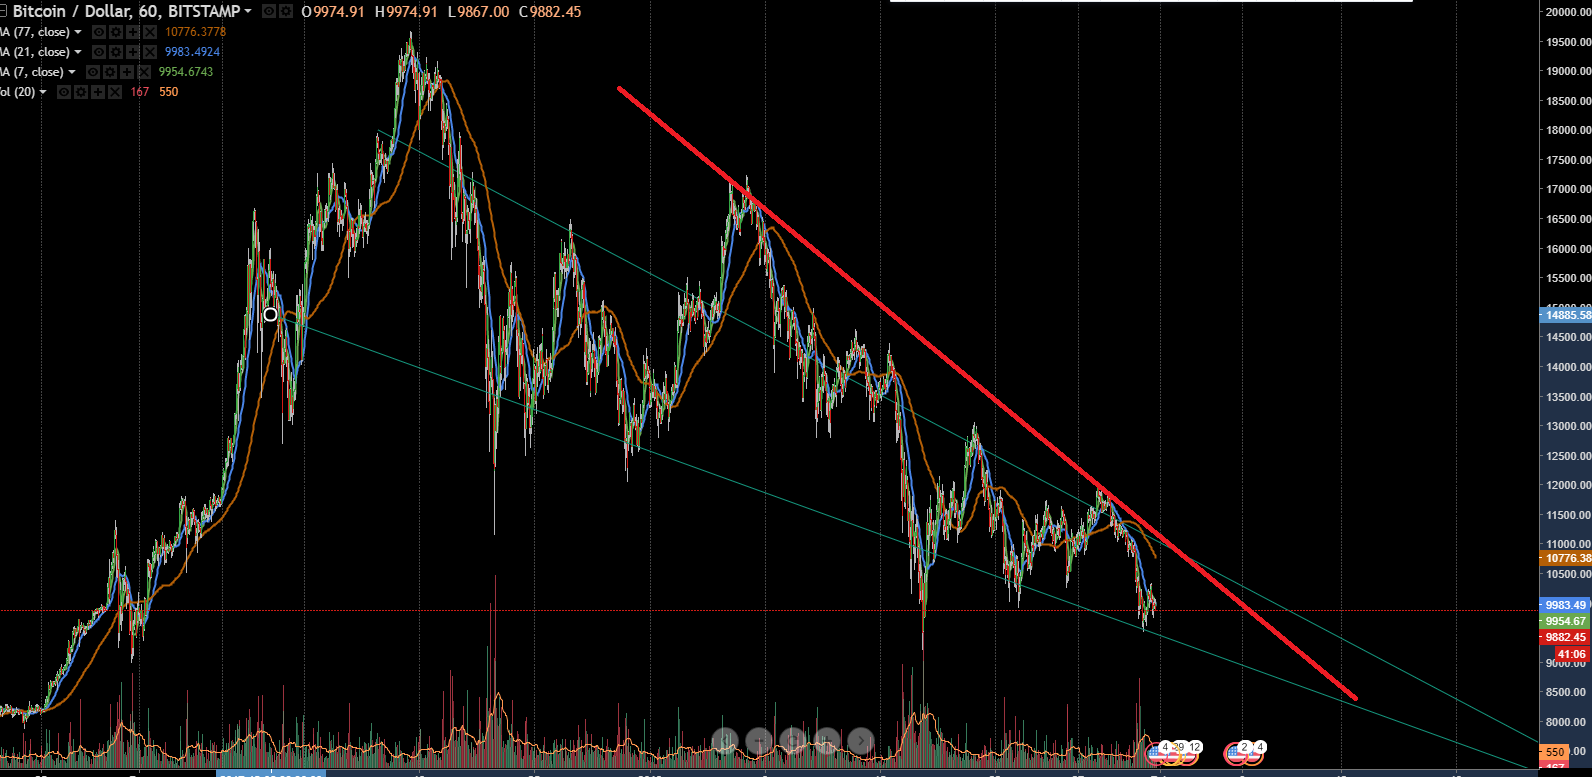
Same chart this time with trading view, my lines are green and @haejin would approximately be the red with no clear start when viewing the greater trend.
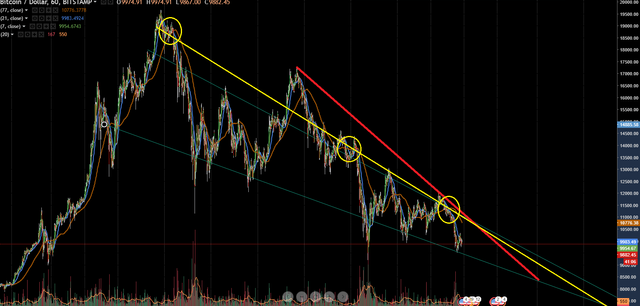
And yet another way to discern upper boundary is to connect as many Moving Average Crossovers (Break downs) as possible
Sorry if my writing seems a bit choppy today, for some reason my fluid writing mojo seems a bit off; maybe not enough coffee..
Again this is not designed to start a war, it's just a difference of opinion. Consider all available knowledge from every available source and make your own decisions. I do agree with the "overall pattern' as it is confirmed by decreasing volume over time, I just do not agree with the upper boundary and timeline.
Update
May be carving out a run for the 1 hr 77 @ 10,700 ill be interesting to see if we can get past 10,300 first and make progress in that direction.. 7:17 p.m. Next would be the 2 hour 77 @ $10900..
My Previous Analysis:
https://steemit.com/bitcoin/@pawsdog/1-30-2017-the-market-view-and-trading-outlook-actual-info
https://steemit.com/bitcoin/@pawsdog/1-29-2017-the-market-view-and-trading-outlook
https://steemit.com/bitcoin/@pawsdog/1-27-2017-the-market-view-and-trading-outlook
https://steemit.com/bitcoin/@pawsdog/1-26-2017-the-market-view-and-trading-outlook
https://steemit.com/bitcoin/@pawsdog/1-25-2017-the-market-view-and-trading-outlook
https://steemit.com/bitcoin/@pawsdog/1-24-2017-the-market-view-and-trading-outlook

Beep! Beep! This humvee will be patrolling by and assisting new veterans, retirees, and military members here on Steem. @shadow3scalpel will help by upvoting posts from a list of members maintained by @chairborne and responding to any questions replied to this comment.
Greetings from South Africa. I came across your name in @artz 's weekly competition roundup and became intrigued by your experiment to hit $1,000,000 in 18 months and am now even more interested after reading your market analysis.
I like how you explain your thinking in way more depth than certain other "celebrity" analysts here on Steemit. I look forward to reading more of your posts. You have a new follower.
thanks, I appreciate it and thank you for the follow...
Hey dude @haejin is the real guy and @heajin is a hilarious fake account made by Bernie.
I have no problems with the correction dragging on, or even 2018 being a bear market.. it is what it is... I'm curious though to what sort of scenarios might transform a bear market to a bull market? What causes a whole lot of investors to jump on something?
It does feel like since Institutional money got involved all the fun was sucked out of the market...
As volume dries up, there will be no sellers left at a certain point.. Keep watching the volume trickle down.. each successive selling cycle is coming on less and less volume now.. It's going to grind on a bit longer.. but it will end at some point when balance is found.. fixed the typo
As volume dries up and there are no more sellers... does that destroy the market entirely or does that transform it to a bull market?
Can you tell selling volume from buying volume. .. or is volume just movement?
Volume is volume, the only thing that really matters is if the bar is Red or Green as that determines who won the time period (buyers or sellers).. Nah, when the sellers run out, meaning nobody is willing to sell anymore, then that is the consensus that a bottom has been reached for the most part. Even the selling periods now are coming on lower and lower volume.. The market is never destroyed it just goes until it passes a balance point, and then swings back up or down to find it again; over and over.. BTC was so hyped that it shot up way to fast; accordingly it was out of balance so to speak. Pulled well away from all moving averages etc. Go look at a traditional stock and watch how the for the most part hang around their longer term moving average. When BTC was 3x moving average, something had to give and this is it.. Now as time passes the price comes down, the averages catch up and we will find balance to build on..
I like how you touched the TA string, a lot of people think that TA is a exact science.We should also add that there are bots and people, who are stop-hunting. They know a lot of people are watching the same thing and they are ready to trigger some stops.
Not even close. We are very far from a true shake-off. I persoanlly have never seen a crash, or say traded a crash, but I am sure this is not it.
Most people are still sitting on mountains of gains, so they have no incetive to cash-out yet. Yesterday I wrote how when a trader/investor starts unloading all of his holdings in pain (emotional and financial) That is the time to load up !
As far as haejin's prediction, I stopped following him long ago. I bought a book on Eliott Waves though. The problem with TA with most people is
that they taylor the chart and lines in a way that they like it. On his chart I really don't see how the lines are OK. However, every TA has his own
methods and ideas.
My opinion is the same as yesteday. We are below all MA's, we are bellow previous support at 10,800 and pervious support at 10,300. Overnight we had an attempt at 9,800 - failed. Today we had ettempt to reclaim 10,300$ - FAiled. So much indecision nowadays in BTC, which makes it easy to confuse. Trends are rarely broken in a day or two.
I am short-term bearish on the crypto-market.
Same here, short term bearish.. I was walking today with my daughter and I was thinking; what if BTC never comes back up? Why should it? What does it offer? What is its purpose? It's antiquated, expensive and other technologies are kicking its ass; so why keep it.. What if it just tails off into nothing as it really is of no practical use...
Lol, look at my last article :D If lightning netwrok does not come soon, it might not go up. Blockchain 3.0 are going to kick his ass. lol.
Great analysis this go around and I really like your approach here.
Thanks for pointing out your disagreeance with haejin's chart. I can see where his faults are. Just be looking at it off hand, it does appear to be too steep. He's also not using the entire chart, like you did, and merely connecting two high points. (forgive my lack terminology)
On the up and up, I'm learning a bit about charts.
I can't help but notice, yet again, how amazing ethereum has done during the crash. As I've said before, ethereum, I'll say it again, Ethereum!
I've told you I'm not much of a chart guy, but above is bitcoin and the chart on bottom is Eth (taken from coinmarketcap)
This is not the first, and it probably won't be the last time, that I've seen Ethereum do this. While everything plunges, ethereum has its own spike.
I see other coins do this on occasion too, but seeing ethereum stay above 1 grand while bitcoin plunges to $9400 tells me ethereum could be on its way to the number 1 spot. Taxes are partially here. Some folks have already gotten an advance. The rest comes after February 10th, I believe, so I'm expecting things to hopefully smooth out.
I thought ripple would have faired better in all this, but here we are.
My reply is also a whole day later, but hey, better late then never :)
True, I think that @ervinneb is onto something in regards to ETH running 1 month behind BTC, ergo major corrective action may be in its forecast as well.. Not sure, but his latest post is pretty neat in that regard...
Would love input from @ervinneb
thanks a lot for the information man 👍☺
No problem... :)