1/26/2018 The Market View and Trading Outlook
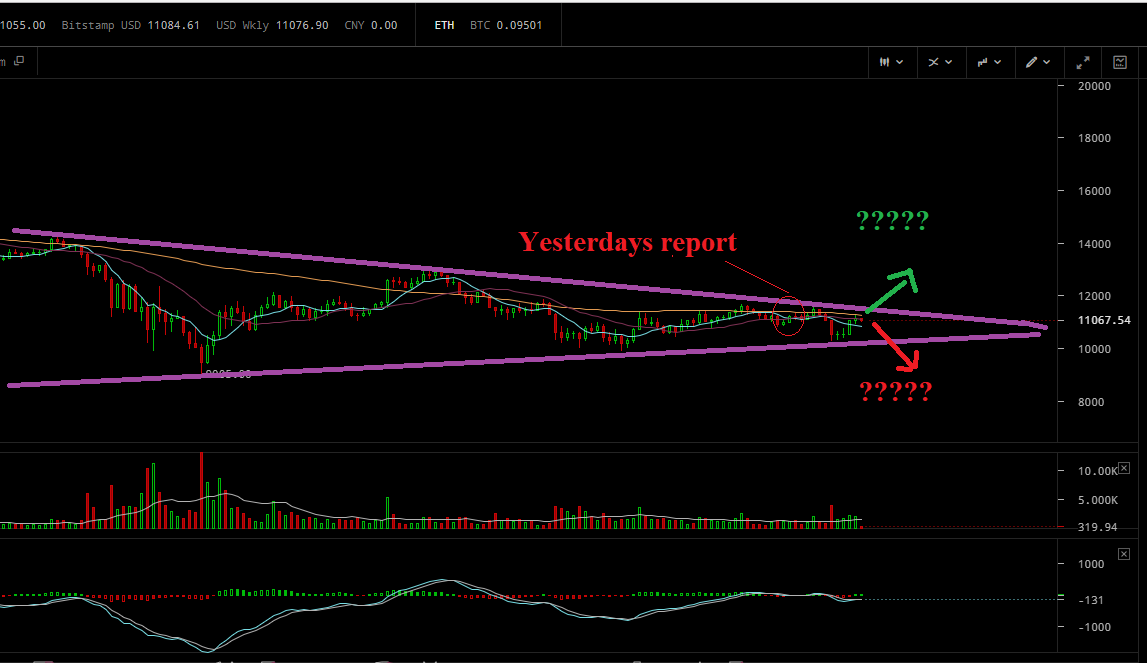
And yet another mini crash as price was unable to definitively pierce $11,600; the upper boundary of the symmetrical triangle. After this definitive price rejection Bitcoin spent the next 5 hours falling 11% to around $10,250 before being bought up and again pushed North of $11,000.
While the precipitous decline in price from $11,600 likely hurt some and forced them to panic sell in the lower ranges of $10,000, it was, as I noted yesterday an expected event.
“another bullish wedge/symmetrical triangle with a floor of $10,136 and ceiling around $11,600.”
Source: https://steemit.com/bitcoin/@pawsdog/1-25-2017-the-market-view-and-trading-outlook
Expect more of the same ranging price action today, with a new potential ceiling around $11,330 with a tentative floor of $10,325 as the range consistently narrows with each passing hour.
This is a pretty epic Bulls vs. Bears battle and entirely too volatile a market for me to enter with 12 percent swings every 7 hours; so I’ll wait it out, perhaps play lightly on smaller time frames and do nothing substantive until I have clear confirmation of trend reversal.
The charts are not really providing any additional insight over those of yesterday; we are still trapped in the narrowing boundaries of a symmetrical triangle with an apex price of $10,450 occurring at 11 p.m on the 29th of January (based on how the lines are drawn on my charts, so this is not definitive as wicks may or may not be included etc but it should be +/- 12 hours). As price tends to break up or down in a big way prior to reaching the Apex we “should” have confirmation of reversal (correction over) or continuation (one more lower low) within a short period of time; 48 hours or less.
Statistically speaking symmetrical triangles:
Break upward 54% of the time and 75% of the way to the triangle apex (upward breakout) and 73% of the way for downward breakouts
Just a quick look at the charts..
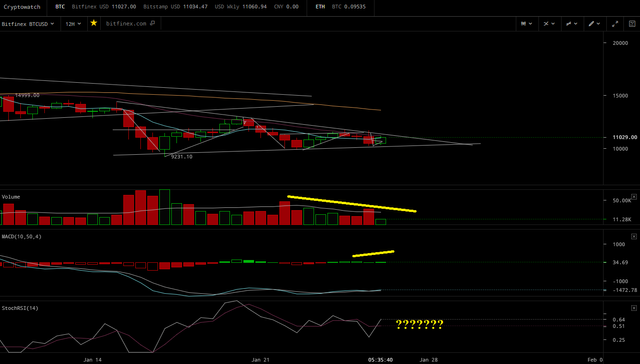
I’m going to do the 12 hour today and then use the 2 hour for illustrative purposes to show progression from yesterday. In the 12, nothing has really changed, MACD is still roughly where it was yesterday, though the recent buy back at $10,300 gave us 1 increasing bar so far which has allowed us to stay afloat a bit longer. The RSI is about as indecisive as it can be hovering at .50. This is indicative of a much undecided market full of hopeful bulls and pessimistic bears continually battling it out. Selling volume nearly doubled during the latest decline increasing to 32k over the previous 16k with current buying volume at 11k. Translation we need consistent period over period buying volume that exceeds the 32k sell off to really cement in a floor and provide the foundation for higher highs. All in all pretty much the same as it was yesterday in regards to being trapped in a pattern full of indecision with no clear indication whether future prices are going higher or lower.
The two hour is for illustrative purposes only as it provides a bit clearer picture of the symmetrical triangle. Circled in red is the market point at the release of my Market report yesterday. So essentially we need to either break through the top or we will fall through the bottom. There may be one more small bounce left from the bottom in which case I doubt we will hit the top again and will likely fold midway up at a sub $11,000 price point in favor of a high volume lower low. For an example look at how we folded on the $13,000 at the previous symmetrical triangle. We went back to the bottom at $13,100 tried to climb, got around $14,000, went sideways for a bit, started trending down, the bottom fell out and we crashed to $9200. If we cannot reach the top of the triangle today, I would likely expect a similar event as thousands of other traders watching this pattern see it begin to fold up and decide to go FIAT until the storm is over.
My Previous Analysis:
https://steemit.com/bitcoin/@pawsdog/1-25-2017-the-market-view-and-trading-outlook
https://steemit.com/bitcoin/@pawsdog/1-24-2017-the-market-view-and-trading-outlook
https://steemit.com/bitcoin/@pawsdog/1-23-2017-the-market-view-and-trading-outlook
https://steemit.com/bitcoin/@pawsdog/1-22-2017-the-market-view-and-trading-outlook
https://steemit.com/bitcoin/@pawsdog/1-21-2017-the-market-view-and-trading-outlook
https://steemit.com/bitcoin/@pawsdog/1-20-2017-the-market-view-and-trading-outlook-evening

Beep! Beep! This humvee will be patrolling by and assisting new veterans, retirees, and military members here on Steem. @shadow3scalpel will help by upvoting posts from a list of members maintained by @chairborne and responding to any questions replied to this comment.
Indicators still point lower, although BTC recovered pretty well from the bottom.
This is how people, who bought from the top the other day felt like today
Lol.. very true, very true... these are the markets that eat up the inexperienced.. When I play in these waters, I play quick short time frames, 1.5% or less limit order profit lock ins ect. I think the main thing that get folks in these markets is 1) buying at the top 2) being greedy and afraid to lock in profits.. I will have to say on a side note though.. that I'm currently liking the little steem market place.. It does not appear as if there are any fees.. so I'm able to work small inefficiencies back and forth making .025 here, .045 there etc.. Not much maybe, 3/10th of a point or so on each trade in either direction, but seems to be slowly working out.
I have to check this internal market out ! So far I have only used blocktrades.us to convert SBD into STeem or other crypto into Steem.
Thanks for the heads up, will try to do that in the weekend :)
Yeah its pretty neat, only SBD to Steem but you can catch a spread of 1%+ from time to time with an average of .025%, volume is low, its a nickel game, but low risk as you can use the SP or steem regardless to power up.. I started playing with it two days ago and have traded up 7 SBD, thus far from the start point.. Like anything else it takes a bit of patience...
Do you have any intel on the country breakup of users using GDAX? Or any info on users by whether they are retail or institutional investors?
I only ask because I'm wondering if there are timing patterns... you convert your trading portfolio to Fiat or something safe overnight.... how many others do that? Is the BTC price lower before say 8am East Coast time?
No, I don't believe anyone but GDAX/Coinbase would have that information. You know I looked into patterns as well back in the day in regards to the EU and Asian markets etc. I think at one time there was always a small drop before 7 p.m. EST but it was never definitive and could not be accurately implemented into a strategy that made me comfortable putting capital at risk. If your asking why "I make the choices I do" its based on the charts and experience. Believe it or not, writing these everyday actually improves my trading as well as it further imprints what I objectively see to be the truth about the market each day into my head that much further. At times I am looking to make a decision/buy/sell and come back here and re read how I felt about it in the A.m. and objectively decide to stick with my previous opinions devoid of the "in the minute emotion/beat the market" mentality. I suppose these are in many ways similar to creating an affirmation each day, much in the same way that I wake up every day and say I'm going to be rich this year.. accordingly life steers itself in that direction as I already see it as reality. Jim Carey did something similar and wrote himself a check for $10,000,000 long before he made it big.. You should likewise do the same and wake up everyday and say I'm' going to make it on "ninja warrior", no doubt, no concern, pure confidence and acceptance of fact.. Sorry for running on.. thinking and typing... I get off on some pretty wild tangents... lol
Hahahaha, it's the tangents that make you so great!
I've actually been playing with this sort of goal setting and working on visualization and meditation. I think I was a naturally silent person, but IT life has taught me to always seek new information/distraction, so I need to control that.
I just noticed a small trend of the markets seeming to be lower first thing in the morning, and rising throughout the day... but I'm only taking very cursory glances but did wonder if there was a deeper pattern there.
I'm not surprised you're becoming a better trader by explaining the process to us, I'm slowly building on my knowledge of the influences and indicators of market action. It's complex but thanks to you seems very doable.
It seems doable is the trick.. Much in the same way beating the house at Vegas by reading a book on counting cards makes it seem doable. It can be, for sure, but it takes more than cursory knowledge and understanding to consistently hit base hits. Took me a few years to get to where I am now, and I think it is much like learning a new language.
At first you know a few words, and may be able to fumble your way through asking how to take a piss or get a glass of water.. As time passes you learn more vocabulary and you can create more complex sentences, until you reach the point that you can begin to teach yourself based on the now preexisting knowledge or you learn how to read in this new language and suddenly the world around you becomes an encyclopedia of information. Trading is much the same.. you will learn some things, MA strategy, RSI, MACD, Ichimoku cloud, volume indicators, etc.. You may learn one, but then you will be able to add on to that with another, and another, until you can begin one to cross check the other, you become used to anomalies and commit them to memory etc. Until you have created your own index of probabilities based on experience and an index that can only be gained through experience.. How price runs after a big move, how it falls, when does it pull back, throw back, retrace, what are targeted moves etc. I'm still learning all the time. For example I go here at least once a day.. http://thepatternsite.com/chartpatterns.html and review a pattern.. when I get to the end I go back to the beginning and go at it again and each time I learn something I missed the last time around.. It's a process, but you have to be dedicated to it, and committed to it.. the good stuff and the pain... much in the same way you are towards your ninja warrior quest.. somedays it sucks, it hurts, but the end goal and become more proficient is the end game that will lead you toward the success you desire.
Thanks for the insights man, really appreciate the effort you put in explaining everything in detail.
No problem, I try to keep it informative and simple...
That was a great analysis, i agree this bear vs bull market is insane. Keep it up, following you now!
Sweet, thank you and I appreciate it... :)
Japanese exchange was hacked , 500 M hacked , that may be the cause of this mini crash !
Nah,, that is the issue, you think the news makes the price... when the price makes the news... see my comments above..
The upwards resistance in the order book is epic...
24,000,000 to go up...
9,000,000 to go down..