1/24/2017 The Market View and Trading Outlook
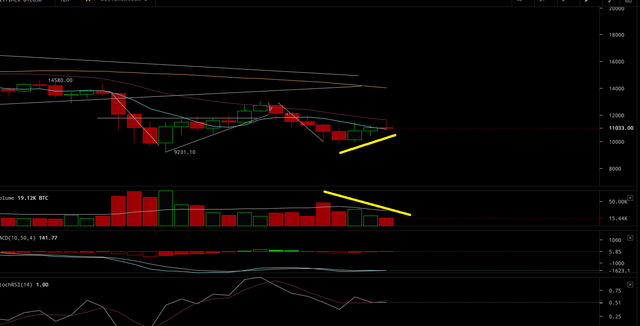
And yet another evening of corrective ups and down has come and gone. As I noted in my analysis yesterday; the $11,300 would prove to be a tough barrier to overcome and consistently close above as it was the convergence multiple other longer term moving averages; the 2 hour 77, the 4 hour 21 and the 6 hour 21.
The first level of resistance resistance will be $10,800 or the 2 hour 21 and also the 30 min 77. If we can break above the next battle will be fought at $11,300 which is close to the 4 hour 21, and both the 1 and 2 hour 77 period moving averages. This will be a tough fight and may be the temporary folding point in price to once again head south recharge, regroup and test it again.
If we can make MA progress in the lower time frames, and that is a big if, the four will provide resistance at $11,450 or the 21 period MA,
---https://steemit.com/bitcoin/@pawsdog/1-23-2017-the-market-view-and-trading-outlook
To this point we have tested the $11,300 zone twice and stumbled back. The first fail dropped us to the 30 min 77 to regroup recharge and try again and now we are sitting on the 1 hour 77 at $10,980. At current the 30 min 77 stands at $10,800. Both of these longer term moving averages may offer limited short term support, if the 1 hour 77 is breached, I do not expect much of a fight at the 30 min 77 as the greater time frame carries more weight in terms of momentum. If both fail definitively we enter free fall territory in search of another point to make a defensive stand. In looking at the chart, the likely next stop or short term defense would be at $9600 or a level that held for a few days in late November, from there is to the weekly 21 period MA at around $9000.
Price is being consistently rebuffed by the 2 hour 77 on lower than average volume and has failed twice to breach this critical resistance point and “would be” support level if conquered. At current it is still anybodies game, though some of the shorter term indicators and time frames are getting a bit more bearish.
Charts, Charts, Charts…
The 12 hour is “mehh” at best.. Granted the MACD Histogram has us green for the moment, volume is going down, price is going up; generally a combination that I am not a huge fan of. Also in looking at the most recent bar which started at 7 a.m., its red (sellers winning), volume at 15k, last period was 20k. In lay terms; volume is 75 percent of what it was during the previous bar only half way into the current bar which ends a 7 p.m. and sellers are for the moment winning. Interpretation is that if sellers continue winning, selling volume for this period will be greater than the buying volume of the last which is a bearish indicator of increasing seller momentum. Again this is crypto so price could swing the other way turn the bar green and buying volume would then be higher than the previous period; a bullish scenario. We do have an MACD/Signal line cross towards the buying side, but I’m just not feeling it. Which could be a problem as I’m not supposed to feel anything and should trade as an emotionless robot who’s decisions are based solely on Technical Indicators. Oh well if I miss it for a bit till I have better confirmation of trend reversal then so be it.
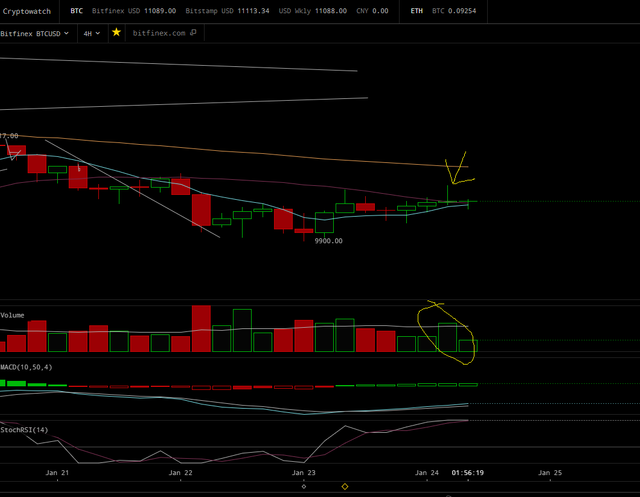
The 6 hour has nothing really great to report; current period sales volume of 15k dwarfed prior period buying volume of 9k. We are in the green on the MACD histogram, with a slowly rising RSI, but the prior period of “being in the oversold” was somewhat short and gives me pause as to how motivated buyers really are.
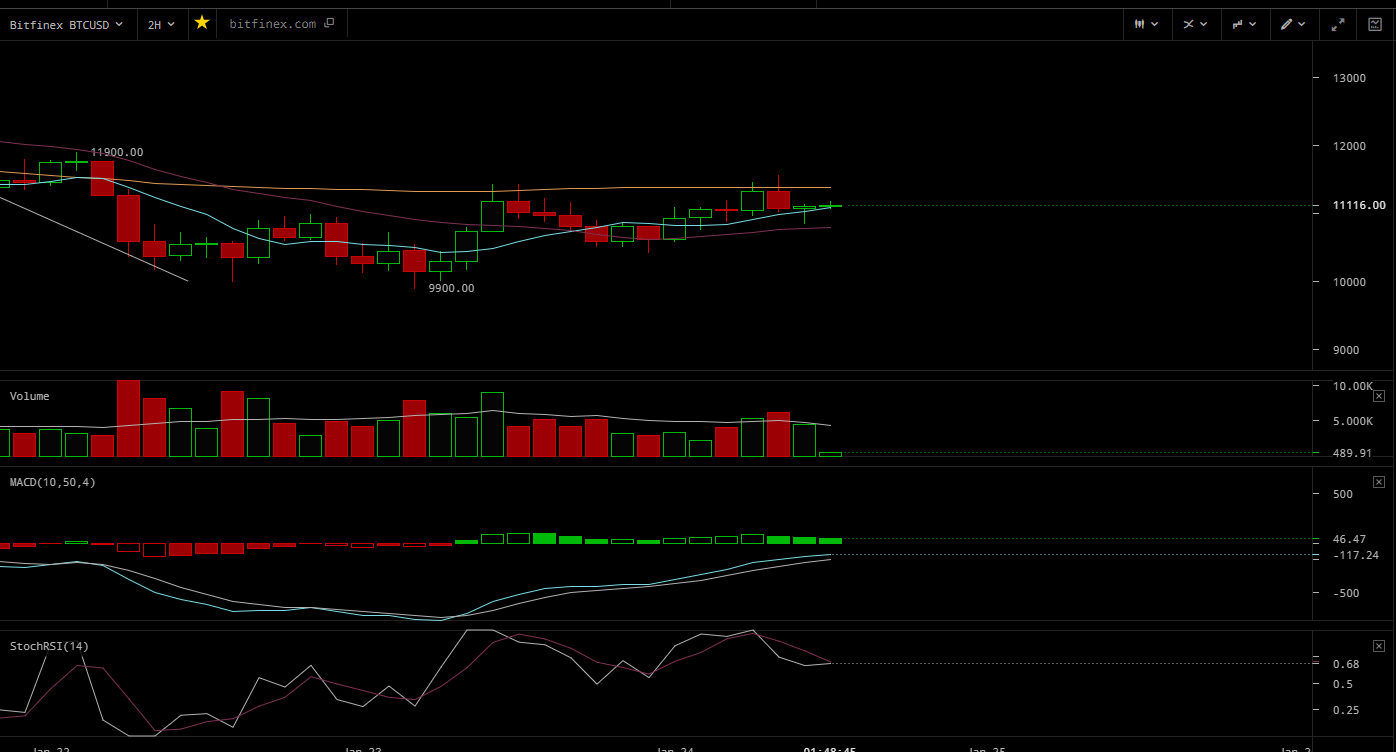
The 4 hour is perhaps a bit more bullish, 4 straight periods in which buyers won the fight, MACD is on the way up to the zero line and we may have an early bullish MA indicator in the form of a 7/21 upside cross. We are in overbought territory according to the RSI, but it is not uncommon for it to remain there for a prolonged period of time as price rises. Nothing screaming buy, buy, buy.. but maybe take a nibble on a lesser frame pull back and see how it pans out. On the downside we have somewhat of a “gravestone doji” indicative of strong price rejection above $11,300 and while some do not subscribe to the theory of “candle stick patterns” they do have merit to some degree as they provide insight into the feel of the market.
Specifically “a Gravestone Doji”
Can be a sign that an uptrend has moved too high, too quickly. This can mean some retracement is necessary before new highs can be made. In this situation the gravestone marks a period of hesitation in a bullish trend.
This can forewarn either of some further price consolidation and ranging or more likely of a bearish pullback.
For that reason we pay more attention when the gravestone appears after a rapid price increase.
In this case the gravestone doji is more likely to be signaling a reversal because the market needs more time to digest the new price levels.
Theoretical performance: Indecision to bearish reversal during uptrends with a tested performance of bearish reversal 51% of the time.
Is 51% of the time definitive, no.. But it lets me know that the market is uncomfortable above $11,300 without some strong volume buying confirmation to provide a bit of faith. Also its still a green gravestone, so that may just be indicative of needing a bit more time to recoup and try that price again.
The 2 hour, we are somewhat deep into the buying period, MACD is approaching zero at about the same time price will be approaching the longer term 77 for the second time. If price breaches above the 77 and take the 7 with it above the 77 I will feel considerably better about our potential longer term trajectory.
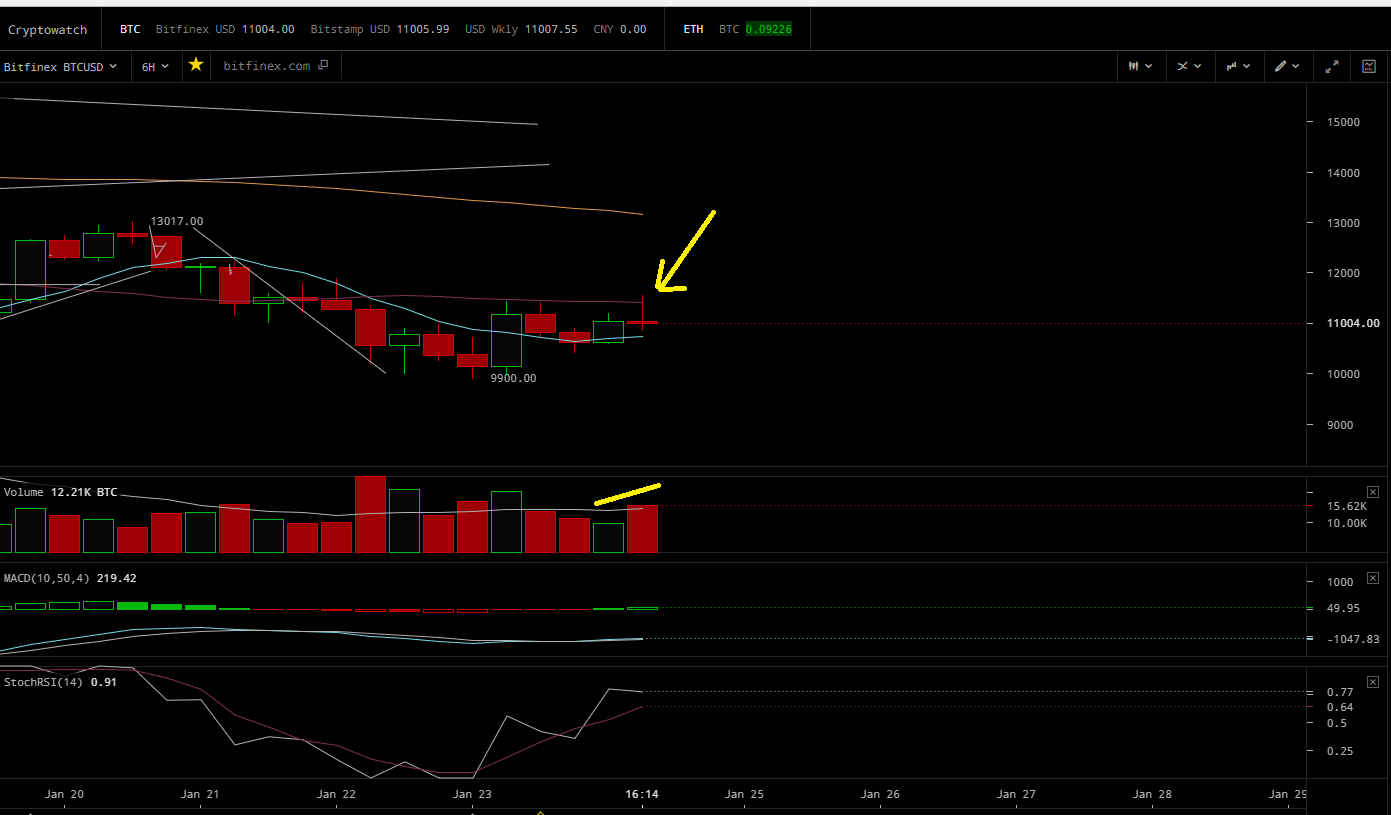
So in summary today is not Bullish, it’s not bearish.. $11,000 seems to be holding and may be the new $10,800 from yesterday. Our daily high of $11,500 is better than the $11,400 of yesterday but we still have some work ahead before we can sound the all clear.
My Previous Analysis:
https://steemit.com/bitcoin/@pawsdog/1-23-2017-the-market-view-and-trading-outlook
https://steemit.com/bitcoin/@pawsdog/1-22-2017-the-market-view-and-trading-outlook
https://steemit.com/bitcoin/@pawsdog/1-21-2017-the-market-view-and-trading-outlook
https://steemit.com/bitcoin/@pawsdog/1-20-2017-the-market-view-and-trading-outlook-evening
https://steemit.com/bitcoin/@pawsdog/1-19-2017-the-market-view-and-trading-outlook
https://steemit.com/bitcoin/@pawsdog/1-18-2017-the-market-view-and-trading-outlook
https://steemit.com/bitcoin/@pawsdog/1-16-2017-the-market-view-and-trading-outlook
https://steemit.com/bitcoin/@pawsdog/1-15-2017-the-market-view-and-trading-outlook
https://steemit.com/bitcoin/@pawsdog/1-14-2017-the-market-view-and-trading-outlook

Certainly looks that way. I also think a false break out is possible.
I agree, the volume is not giving me a lot of faith.. and the two hour 77 is holding strong so far.. I could see a push up, then a quick fall back.. we have the 12 on our side, but enthusiasm seems to be a bit on the low side.. There are plenty of buyers in the lower ranges so somebody either wants it or is trying to stabilize the price at a point they are comfortable with..
Sideways action in crypto, never thought I will see that :D This is a situation you can lose a lot of money, if you become impatient. Thanks for the comment.
I agree, this is a tough time to trade if you do not know what your are doing.. "Death by 1000 cuts"..
I know it as - " Death by 1000 paper cuts" I guess it's the same :)
Same same I would thing.. many small cuts till all the capital is gone...
Beep!Beep! @shadow3scalpel & listkeeper @chairborne have your six new veterans, retirees and military members on STEEM. We’ll be patrolling by to upvote your posts (because you are on the list) and we'll answer any questions you leave us. Comment by @shadowspub. This is a opt-in bot.
thank you a lot for this informative force ... upvote for u :)
Thanks I appreciate it...