2/10/2018 The Market View and Trading Outlook
BTC, going to the moon or not? Good question and I don’t have a definitive answer other than long range it may, but more than likely today won’t be the day. In fact more than likely BTC will spend today, potentially tonight and early morning tomorrow in a bit of a slump that may pull us down to around the $7800 level before “possibly” making a definitive move upwards.
BTC is currently $8780 and I know I’m going against the Steemit Donkey on this call, but hey I gotta be me and it has worked out well $$$ so far.. :)
For my reasoning lets go to the charts.
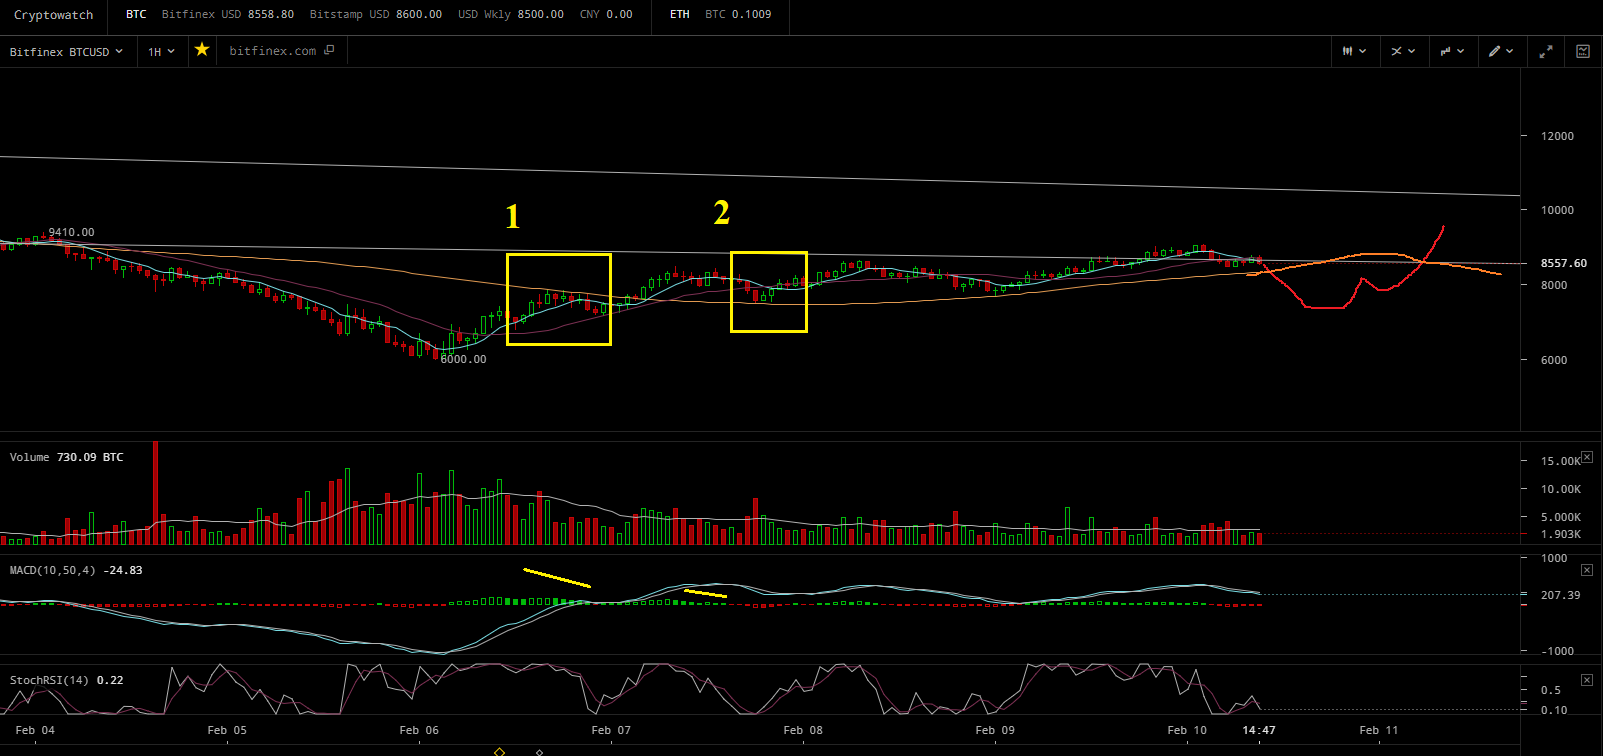
I’m going to start with the 1 hour to demonstrate a point as there are things that assets do that typically repeat over and over regardless of time frame. In this instance, price always runs into a barrier as it approaches a longer term Moving Average; in my charts I use a 77 period (orange) as my longer term. Another interesting thing is that the larger the time frame the greater the rejection prior to breakthrough.
(Number 1) we can see that after BTC recovered from $6000 it ran up to the average at $7700 was rejected for $7300 recovered and moved up and through the average.
(Number 2) After breaking above it reached $8450 then it did what assets normally do, faltered and came back to $7700 to test the top of the MA as support and moved on from there. This is a fairly routine cycle that usually goes as follows: rejection, breakthrough, breakdown to test, new high, a few bounces (usually 3) and a break below; then the cycle will repeat in a bullish market. My projected trend lines are included.
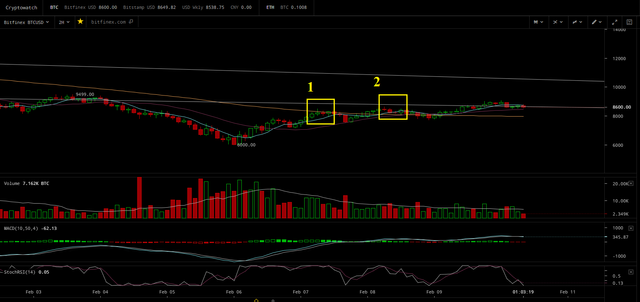
Moving to the 2 hour you see the exact same pattern.
(Number 1) Price ran up to $8450 or the 2 hour 77 (which was also the peak of the prior break above the 77 for the 1 hour); price was then rejected for $7500.
(Number 2) Price then recovered, gained some steam, broke through to $8700 and came back to retest the 77 at $8100 and is now bouncing.
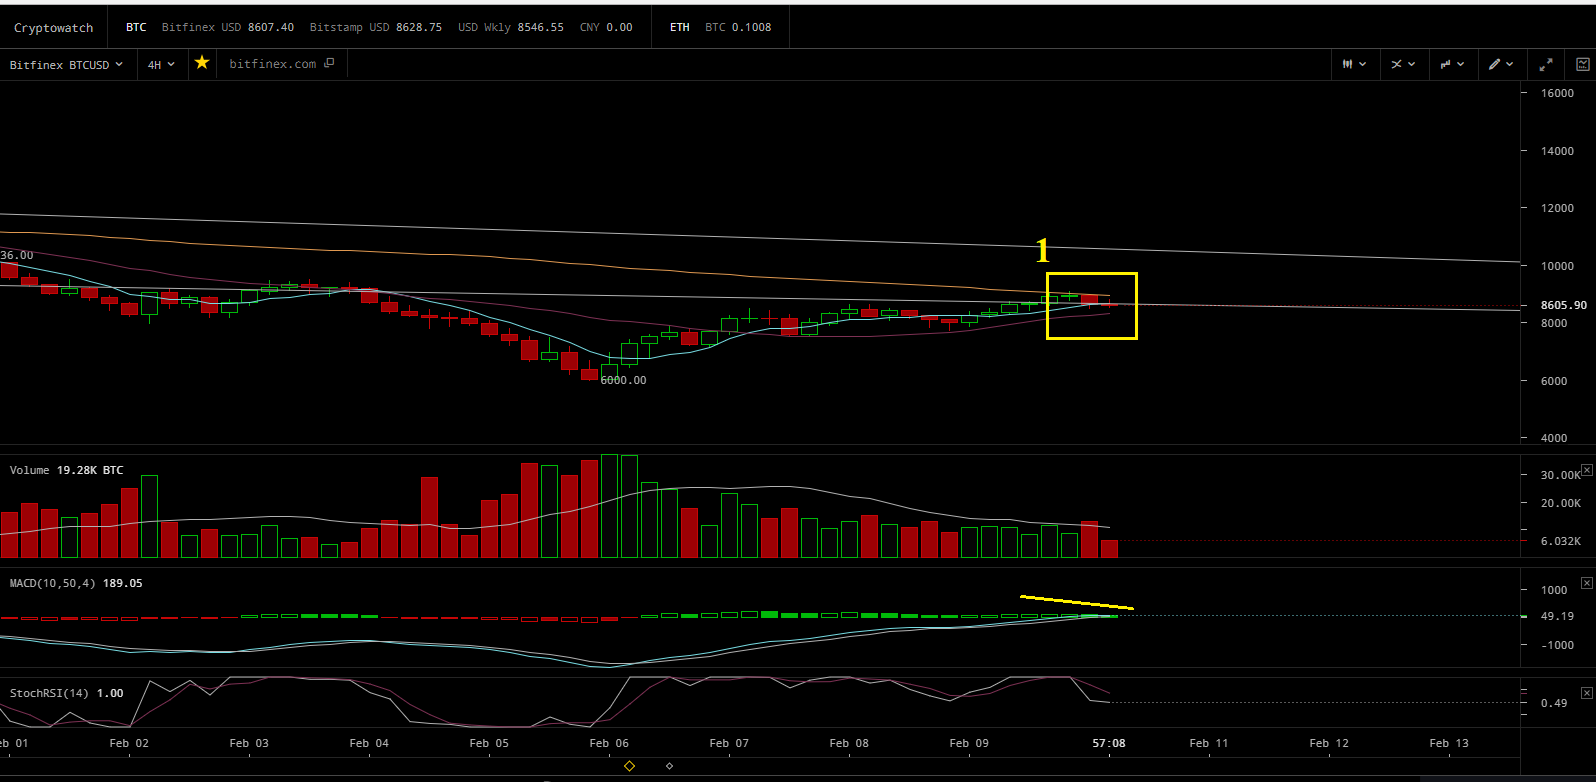
Moving to the 4 hour.. Oh shit, what do we see?
(Number 1) price moved up to the 4 hour 77 at $9100 and is in the process of being rejected so as to gain momentum for a break above.
So where is it likely to find support? You have to step back to the 2 hour, as price likes to bounce the 77 a few times prior to breaking below, we find that the price at the 2 hour 77 is around $7900. This will most likely be in the neighborhood of a low for the 4 hour rejection it may be higher as time progresses and it slowly creeps up as price stays above it.
That said, price does not usually stop dead on the 77 and most often breaks a bit below it on the test. So, I theorize a 4 hour rejection low of somewhere between $7700 and $7900. I will be able to better narrow it down as time progresses.
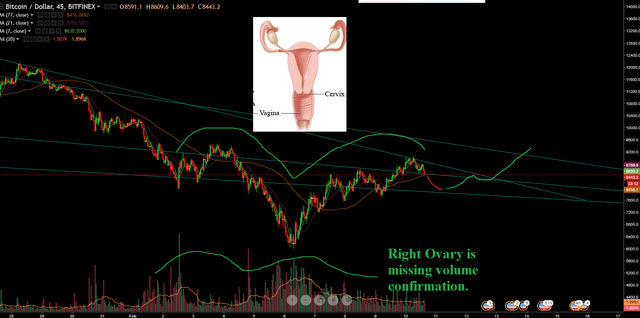
Further evidence of this can be found by the fact that we currently have a “vagina pattern” on the charts. Yes, I know it’s a potential inverse head and shoulders, but I like to amuse myself. That said on the Left Ovary we had a spike in volume, the same occurred in the lower uterine area just above the cervix, the right ovary is currently missing volume confirmation and the pattern is incomplete without a turn down to round it out.
In looking at the wedge I drew way earlier on January 31st.
https://steemit.com/bitcoin/@pawsdog/1-31-2017-the-market-view-and-trading-outlook-actual-info
It is likely we will come down to test the bottom of the Haejin line for support, which oddly rests at around $7800 (coincidence, no?) as it coincides with the current 2 hour 77. We never broke above my top line from above, whereas yesterday numb nuts was saying:
“The upper line of the wedge pattern has been BREACHED!! So far, the BREAKOUT looks DECISIVE!! This is always an exciting time to witness the birth of a breakout....makes me feel like a new Daddy all over again!”
I mean you can certainly review my counter numb nuts calls, starting here”
https://steemit.com/bitcoin/@pawsdog/2-7-2018-the-market-view-and-trading-outlook
And compare what I said would happen that day, with the vagary that numb nuts provided:
“Bitcoin (BTC) overnight price action has maintained it within the wedge pattern. The Bull Wick allows a rapid and clean washout of remaining weak holders; the would be sellers”
Source: https://steemit.com/bitcoin/@haejin/bitcoin-btc-morning-update-what-would-signal-a-bottom
Go back a day or as far as you like.. :), my previous calls are below..
Oh' wait now comes the part where his lemming army spams up my blog by telling me I'm jealous I can't make such miraculous calls with such stellar accuracy..
 .. ..
.. ..
lol.. sure..
LTC
I will also go against his “BUY LTC NOW” @$163 call from this A.M. as well;
I mean unless your down for losing 12% or so, but trade the way you like. Personally I would rather seek a buy around the mid to high $140 level as it stands now; this may change lower or higher, but I’m certainly not buying now. Why? Well as I have noted before BTC is likely to pull back and take the market with it so it is more than likely that LTC (being part of that market) will pull back as well. But as I have pointed out, ridiculous bull calls on ALTS in a BTC downturn are part of his gig.. so why would he change now..
Lastly for Alt Lovers.... Check NBT in times of BTC correction, you may like what you see...
My Previous Analysis:
https://steemit.com/bitcoin/@pawsdog/2-7-2018-the-market-view-and-trading-outlook
https://steemit.com/bitcoin/@pawsdog/1-29-2018-the-market-view-and-trading-outlook
https://steemit.com/bitcoin/@pawsdog/1-27-2017-the-market-view-and-trading-outlook
https://steemit.com/bitcoin/@pawsdog/1-26-2017-the-market-view-and-trading-outlook
https://steemit.com/bitcoin/@pawsdog/1-25-2017-the-market-view-and-trading-outlook
https://steemit.com/bitcoin/@pawsdog/1-24-2017-the-market-view-and-trading-outlook
https://steemit.com/bitcoin/@pawsdog/1-23-2017-the-market-view-and-trading-outlook

Thanks for the informative post.... :)
No problem..
That's the most anatomical TA I've ever seen:). I'm an RSI, MA, EMA, MACD kind of guy. I have the Elliot Wave Principals book and read half the first chapter. I'm learning slowly. But I think all the analysis only helps one to think and then adjust. Do you trade full time? How long have you been trading and when did you start in with cryptos?
Yes I trade by profession/since the mid 90's/I bought my first BTC at $43 bucks (still have it, well maybe not that one, but I keep 1 BTC at all times, sentimental I guess, thinking it is still that first one.... ) lol..
Anatomical TA.... :)
It seems that you were right here and BTC did break through to $8800. I do think we are going to see it above $10000 in the coming weeks, but there is always a chance the price would be suppressed by bad news that could scare some investors into selling.
At this moment I tend to agree with you. I'm not a long range forecaster as I trade in frames, but as far as today goes.. I'm seeing support from $8368 down to $8200.. those will be hard floors to break.. that said, in looking perhaps a bit longer range, I expect a bit of sideways trading..
If you trade daily isn't sideways trading the best scenario for you as things are stable and you can trade the natural fluctuations? Or is it too hard? I've never really went into this type of stuff, so there are things I might not understand here. That's why I'm interested in the longterm trends, they seem to be easier to grasp and work with for me and my limited trending experience. In the end, steem always seems like the best thing for me and I've only traded recently because I needed to fiat out a bit.
Sideways can be quite difficult as there is not clearly defined trend in many instances and reversals can happen in an instant in the crypto world.. With stops you can do o.k. trading sideways depending upon the size of the predictable range.. Right now, at this moment.. I'm not trading today.. Some of the trends are up, some are down, and the risk of reversal is to high in BTC at the moment.. I'll wait it out.. I do have some limit buys at 8175.. but other than that I'm basically in cash at the moment..
Thank you. My goodness... Vagina patterns, left ovaries, and trolls popping up telling you that you are jealous. lol! I vote this as "Most Interesting Market Analysis" for the day. Bwhahaha!

Thanks, I was hoping people would get my humor and not be offended...
Lol, I missed your analysis ! As always you are spot on, friend ! Can you make a post ( maybe you have one, but I missed it) about how you exactly make your analysis, I get the basics with the hourly charts, but I have a problem understanding when and which tool do you use ! from what I see you are very successful with your analysis - great ratio ! A pleasure to read your analysis !
Only 8100 low so far, I may be wrong which is o.k... 12% drop is still a win for me.. Still likely to go lower though I think.. possibly a fake rally.. How do I do it? Experience mostly.. I love the MACD, and MA's.. RSI is good too.. much of it is just knowing the frames and how one relates to the other. If you can figure out the 77 and watch how price plays with it in different frames, or you may be at the 4 hour 21 which is also the 77 in a different frame, so you have 2 MA's of resistance or support.. It's hard to explain other than to say that each time frame depends upon another, each is an ingredient in the entire recipe and each carries weight.. I use those and then I use overall long range pattern recognition as well to test my theories against the bigger picture and see if what I am thinking based on the time frames agrees with my objective view of the larger market.. Good on LTC at 148 but I will likely sell at 155 or so.. as I am not feeling it.. Will wait and see how it plays out.. I'm a short range kinda guy...
There is also momentum that I think about, just because something goes up or down does not mean that is its terminal direction in the shorter term. In many cases it goes up, to burn out the buyers and gain momentum for the down to make a new low.. same for going down to burn the sellers and make a new high..
interesting, I am trying to understand your methodology, but it's kind of hard when I don't see your thinking process :)
Ok, I don't think of it as a continuous unbroken process. I think of it as periods of time. Like innings in baseball, or quarters in football.. Now each time frame the 1,3,5,15,30,1h,2h,4h,6h,12h, 1d,3d,1W are all part of it but to a greater degree.. That is first.. think of each frame as an inning or a part of the greater sum.. what happens in the 15 min will affect the 30 minute, what happens in the 1 hour will affect the 2 hour and so on.. Trends begin and end from the bottom up, not from the top down.. The 1 minute has to go bad, then the 3,5,15,30.. etc. to affect the larger frames, but the smaller frames are influenced by the bigger frames.. So Lets say we are selling or red on the 12 hour MACD, well.. we know that even a buying period on the 1 hour is going to be minor or muted as the period of greater influence is selling..
Lets assume each time frame has a weight.. the larger the frame the bigger the weight.. so lets say the 4 hour is selling, but the 15 minute goes green, but where in the four hour selling is it going green? the beginning, the end.. if it is at the end or when the histogram is narrowing it may be the very beginning of a change of trend. If it happens at the beginning, the negative influence of the bigger frame (4H) will act upon it and stop it from doing anything really good.
Now you have to take the MA's into account as they are the most basic but most dependable support and resistance lines.. the 77, the 21, etc.. You have to look at MACD, all the frames and then look at MA's in all the frames and compare their probable destination with current MA position.
So lets say the MACD histogram for the 4 hour is red, and price is under the 15 min 77 period moving average. We know the 77 is resistance, we know the larger frame is negative, so more than likely the combination of the two will mute gains bring a rejection at the 15 min 77 and downwards price. That will then affect the 30, the 1 hour, etc.. and you end up with one more hollow red bar in the 4 hour..
If you can understand the relationship between the frames, how they act, and influence each other then you can begin to see how the price moves relative to those frames and the MA's within each one. The MACD is a good indicator of "what is the trend" in a frame, then you have to understand how that trend in that frame relates to the other frames and the moving average support and resistance lines..
Okay, I will "demo" a bit with your approach. Will address question that arise ! Thanks for the detailed explanation.
Low overnight was $7851 I made the call in the a.m. at $8900..
Not bad to call a 12% drop within 2% of my lowest low and .07% of my highest low 13 hours ahead of time..As I said I don't need weeks or months, I just need now.. .. Not sure how I do what I do.. maybe intuition as you said, but it seems to work..
Very interesting. I am wondering where it will close today ? :)
More important is I made 8% more BTC buying NBT at 000116 and selling at 000126
Isn't NBT designed to be stable and so on :D llike USDT
It is and it seems to work quite well... :) If BTC is going down move BTC to NBT, sell when BTC starts going back up..
We need to turn up today or we are going very low again.. Not sure who won our "what will be the low bet" The 12 is tapering off and we are having trouble with the 30 min 77..
You refer to 77 often. What is it?
the 77 is the 77 period Moving Average.. Everyone has their own likes and dislikes.. I have my MA's set at 7,21,and 77..
Chrystal clear. Thank you. I use 50 DMA and 9 day EMA.
I run 3 SIMPLE moving averages.. 7,21,77...
You please remove my flags, I do not want to make any jagda with you
Thank you for the upvote @geronimo..
whats your problem