1/12/2017 The Market View and Trading Outlook
We may be turning the corner towards to make a run for the top of either a bullish triangle or bear flag. As I stated yesterday we still have to go up before we can go down and so as we can have a more definitive answer as to what the longer term future will bring about. As such buying opportunities are opening up and the majority of indicators are pointing to a gain of at least $2000 per BTC in the coming days. That said do you own research, I may be wrong, these are just my thoughts, don’t blame me if you lose $$$ etc.
No speech today, let us get right to it.
The 12 hour and other lesser frames played out pretty much exactly as I said at the time of yesterdays writing. https://steemit.com/bitcoin/@pawsdog/1-11-2017-the-market-view-and-trading-outlook
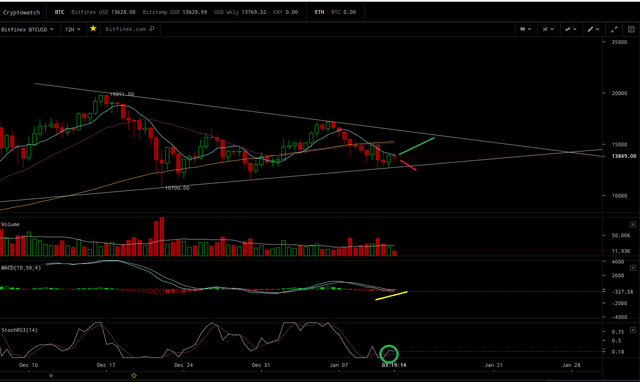
”We have broken below MACD 0 (Bearish) and we may still suffer some more ill effects from the 7/77 downwards cross that occurred at $15,142 on Jan 9th. This would likely manifest as another shake out and retest of the triangle bottom around $13,000 sometime tonight or tomorrow.”
Objectively we have our first buy indicator of this period in the form of an RSI cross, we also have what “appears” to be a close of the selling period rapidly approaching on the MACD histogram. We do not have an MACD/Signal line cross, nor do we have moving average confirmation. That said as the delay in averages is so extreme for this period it is likely that we could top the triangle and be heading back down before we have moving average confirmation. What I do not like about this frame is that we are -327 below the MACD 0. Granted this is a miniscule amount in regards to this frame but it is still below zero though it could be considered to be riding the zero based on this frame. That said I would not be totally surprised to see a smaller follow on selling period to test the triangle bottom again but I’m not betting on it and even one more retest would likely not affect the histogram for this frame. The bottom of the triangle is at current offering tremendous downwards support and I do not see that changing in the near future. I think, based on the indicators of the lesser time frames that I will begin adding to an earlier position more deliberately when I see the first green indicator on the histogram.
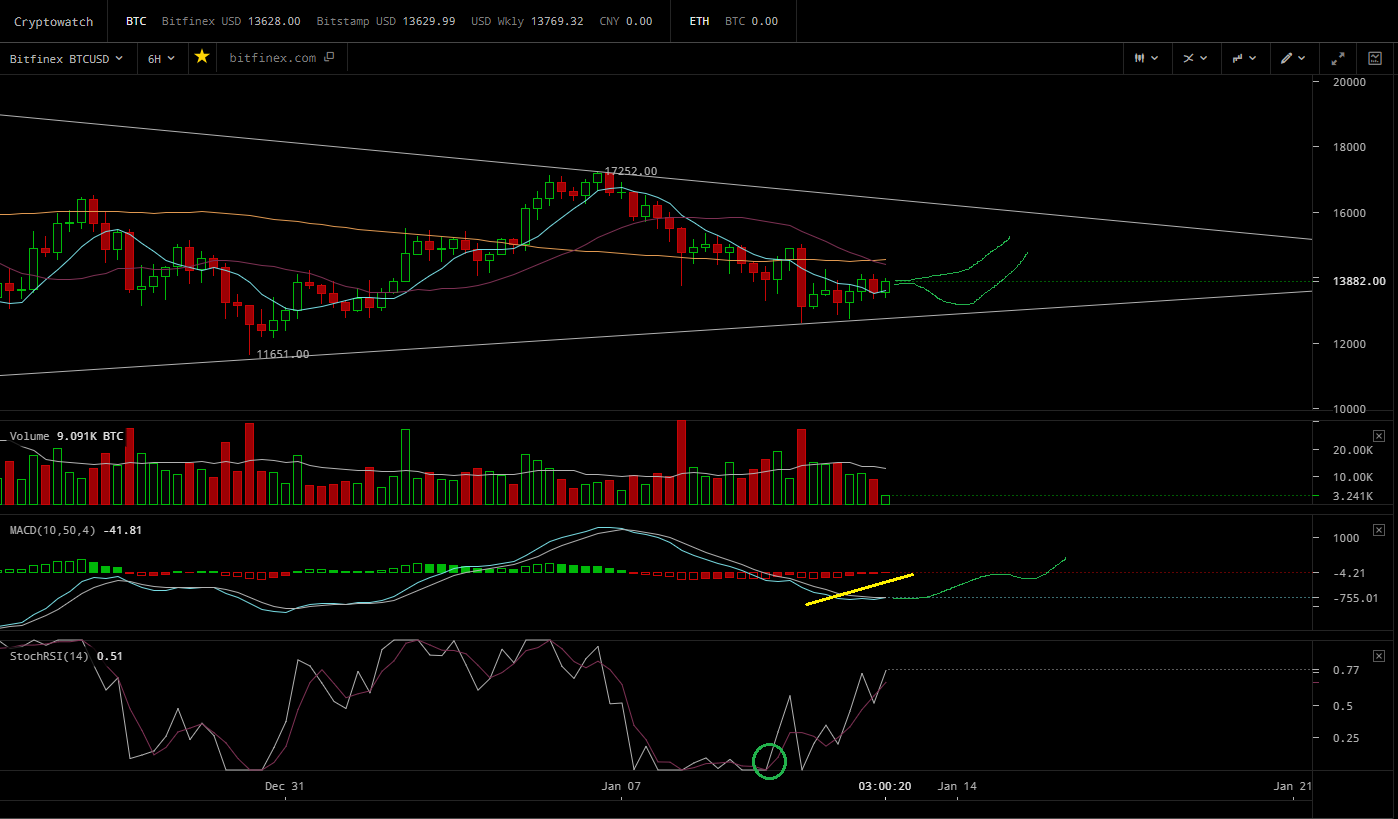
The six hour is pretty much the same story. We have one buy indicator in the form of an RSI cross, no moving average confirmation and are still below the MACD 0 which will serve as upside resistance likely at $14,500 which is the 77 period moving average for this frame. If we make it to that point, more than likely expect a stumble, and possibly a mild shakeout in the form of a rapid 3-5% or retreat followed by an equally aggressive follow on buying period. Objectively speaking the MACD Histogram has this selling period very likely to close out, though it has not yet; ergo there is no confirmation and I cannot buy based on this period. I am not totally sold on it breaking up from here and may break down once more for a retest. I’m 50/50 on it at the moment and only feel that way as price is having difficulty with the longer term 77 of the smaller frames like the 1hr, 2hr, etc.
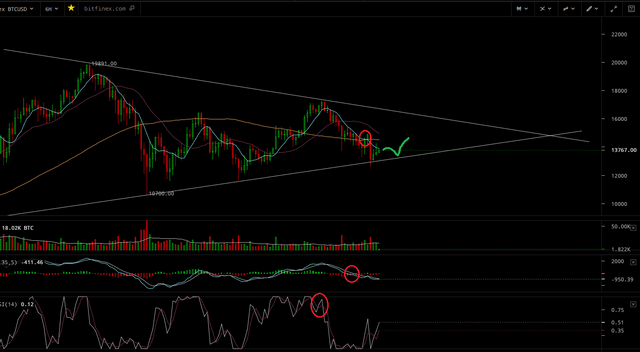
My 6 hour drawing from yesterday depicting the second test of the $13,000 that happened late last night and into the A.M.
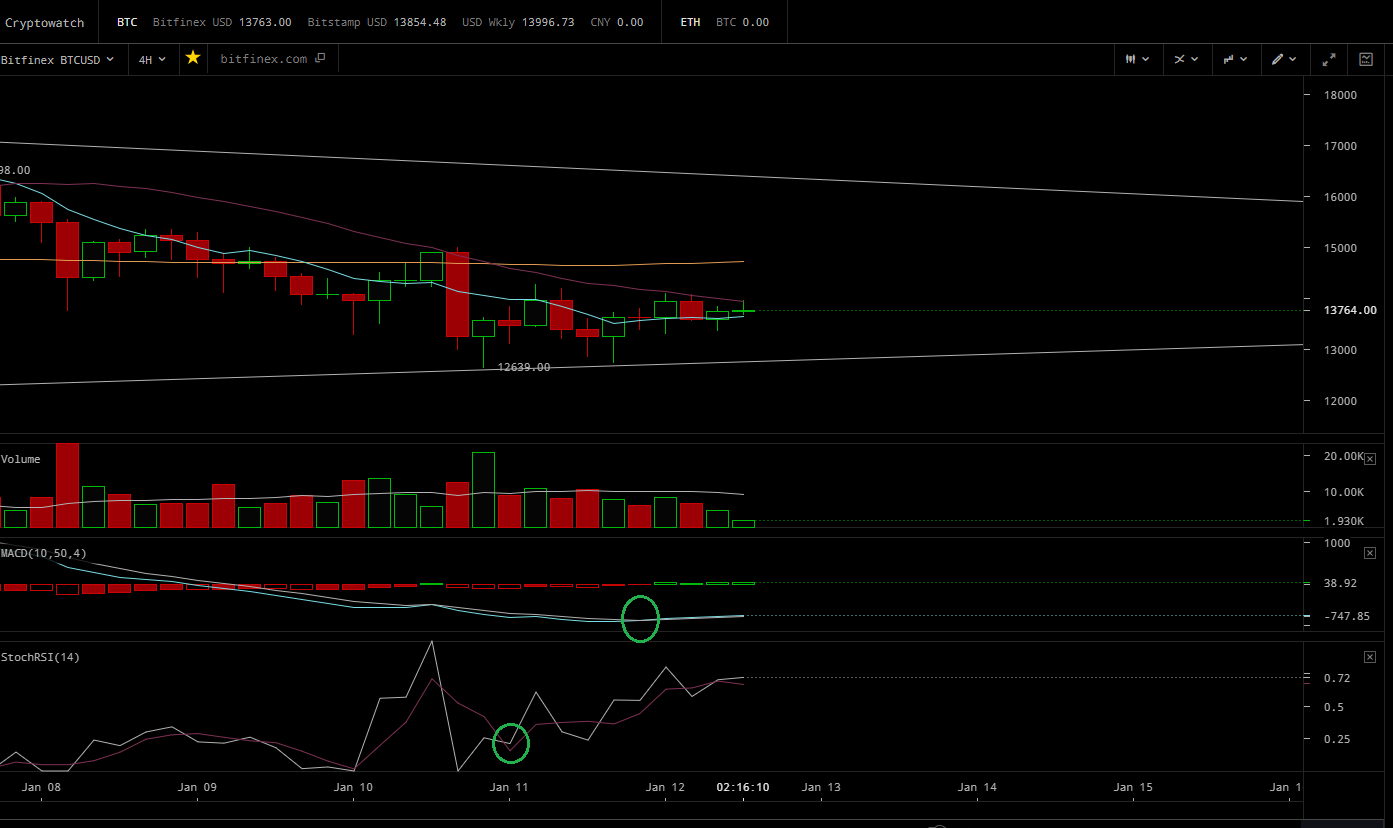
The four hour is looking better than it was yesterday. We are in a buying period as I expected would be the case, though volume and enthusiasm according to the histogram seem to be lacking. We may get a non eventful follow on selling period that does much of nothing to price or it may pick up if we can begin making some ground in the lesser time frames. We may have 7/21 upwards cross approaching though it has not occurred yet. It has occurred in the 2 hour which is generally a good indication. The RSI is pretty much a mess and offers no clear answers in regards to crossovers save it is slowly trending up. We are still below MACD 0 but things are likely to turn around as we need to go up regardless to determine what the outcome of the longer term pattern will be. I do not see us crashing through $12,900 as the triangle or flag bottom has been providing extensive support thus far.
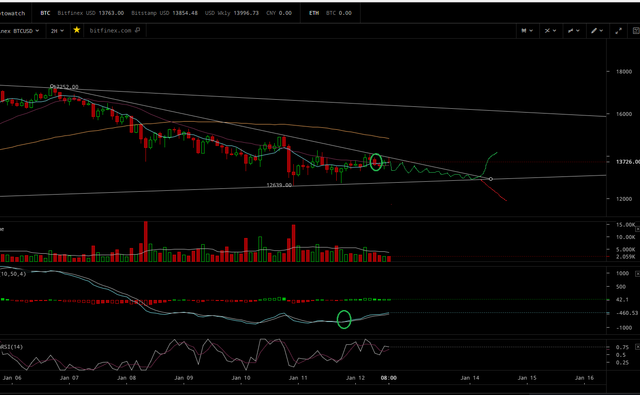
The two hour is looking much better than yesterday, though we may be reaching the end of this buying period based on volume and the MACD histogram (enthusiasm indicator). We had a buying period start at 9 p.m. yesterday, almost closed out at 11 a.m. today and we are in follow on period that may fizzle before we attempt to reach the upper levels. We are below MACD 0 and trending up, we do have an MACD crossover bullish and a 7/21 upwards cross under the 77 which is again bullish. As there is a delay with moving averages, there may be one more 2 or 3 bar selling period before momentum is gained. This may provide the umphh needed to break MACD 0 to the upside. Lastly and this is not scientific by any means but when in doubt draw lines. So in drawing a line from the breakdown at $17,200 and following the 2 hour price highs down thus far we are rapidly running out of time to make an upside break. We are at a somewhat critical stage in that regard and may follow that line back down to the $13,000 once more before making an upside break as price will have no choice but to break down below the $13,000 or get its ass in gear and head upwards to test the top of a bullish triangle or bearish flag. Alternatively we may break through at any moment which would be a very seriously short term bullish indicator
************************
update 7:10 p.m.
*******************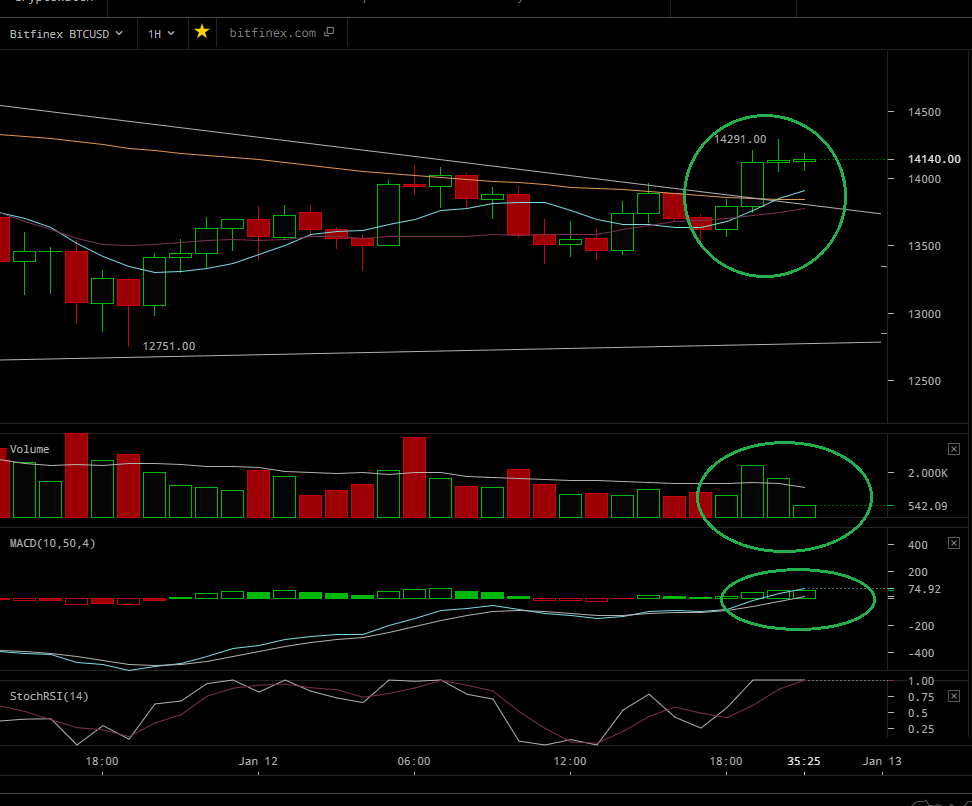
Here is the break through the upper trendline of price since the breakdown at $17,200. This is bullish and indicates it is time to begin taking on positions. This line as well as the longer term moving averages will now offer support to the downside. Do not get shaken out if we retest it once more..
Also the charts and diagrams come from here: https://cryptowat.ch/bitfinex/btcusd/2h
I use these as they are free and you can use them to match my setting or create your own.
My Previous Analysis:
https://steemit.com/bitcoin/@pawsdog/1-11-2017-the-market-view-and-trading-outlook
https://steemit.com/bitcoin/@pawsdog/1-10-2017-the-market-view-and-trading-outlook
https://steemit.com/bitcoin/@pawsdog/1-9-2017-the-market-view-and-trading-outlook
https://steemit.com/bitcoin/@pawsdog/1-8-2017-the-market-view-and-trading-outlook
https://steemit.com/bitcoin/@pawsdog/1-5-2017-the-market-view-and-trading-outlook
https://steemit.com/bitcoin/@pawsdog/1-4-2017-the-market-view-and-trading-outlook
https://steemit.com/bitcoin/@pawsdog/1-3-2017-the-market-view-and-trading-outlook
https://steemit.com/bitcoin/@pawsdog/1-2-2017-the-market-view-and-trading-outlook
https://steemit.com/bitcoin/@pawsdog/1-1-2017-the-market-view-and-trading-outlook
https://steemit.com/bitcoin/@pawsdog/12-31-2017-the-market-view-and-trading-outlook

After holding the 13k level yet again, I can say that this support level is key now. We should also consider the World Economic Forum on 23-26th of January, when the worlds financial elite gathers - I think that meeting is a potentially dangerous one for crypto.
As always - good work.
True and true, but we should reach the top of the triangle at $15,000 plus well before then.. Indicators say buy at the moment. We just broke the upper trendline of the breakdown.
Those dudes can really cook a deadly poison on that witchcraft summit!
p.s. Discover the new way of TA here for BitShares #7 and Steem #7 is explained in detail why. I hope it is helpful info!
Hello my friend.
This is all very exciting and just adding to the momentum that will take us all to the TOP. Buy more and Hold Longer !! Stay strong and wise with all that you do !!
Thank you for sharing
o ya resteem to you !!!
thank you
Don't get to ahead of yourself. Yes the indicators are saying buy.. That said do so carefully, go in say 30 percent of what your are working with in your capital for BTC. Let it run, await a pullback on the smaller frames to provide upside confirmation again and add too. That said we are coming right back down sometime after $16,000 more than likely or less depending upon how long it takes to get to the upper boundary. The longer it takes the lower the ceiling. Remember the triangle slopes to a point so the ceiling gets lower and lower with each passing hour
thank you
great post
Thank you for your kind words
Man, You are right I think that it will be a breakout upwards! I go now (after easing my soul a little in that comment # I mention you because i file you as my partner, mate!) and write my own analysis!
p.s. What do you think about that Dodge Tomahawk thing from above comment? Need's some spear shorts in back pocket after a few accelerations! He he he! :- )
I agree the indicators are pointing upwards for the moment..
I think the key level is $15000 is now turning point in Bitcoin destiny Because from this point on it will start major push to the new all times height. (you miss my comment?)
Beep!Beep! @shadow3scalpel & listkeeper @chairborne have your six new veterans, retirees and military members on STEEM. We’ll be patrolling by to upvote your posts (because you are on the list) and we'll answer any questions you leave us. Comment by @shadowspub. This is a opt-in bot.