Bitcoin (BTC) Morning Update: Higher Lows and Lower Highs

SUMMARY
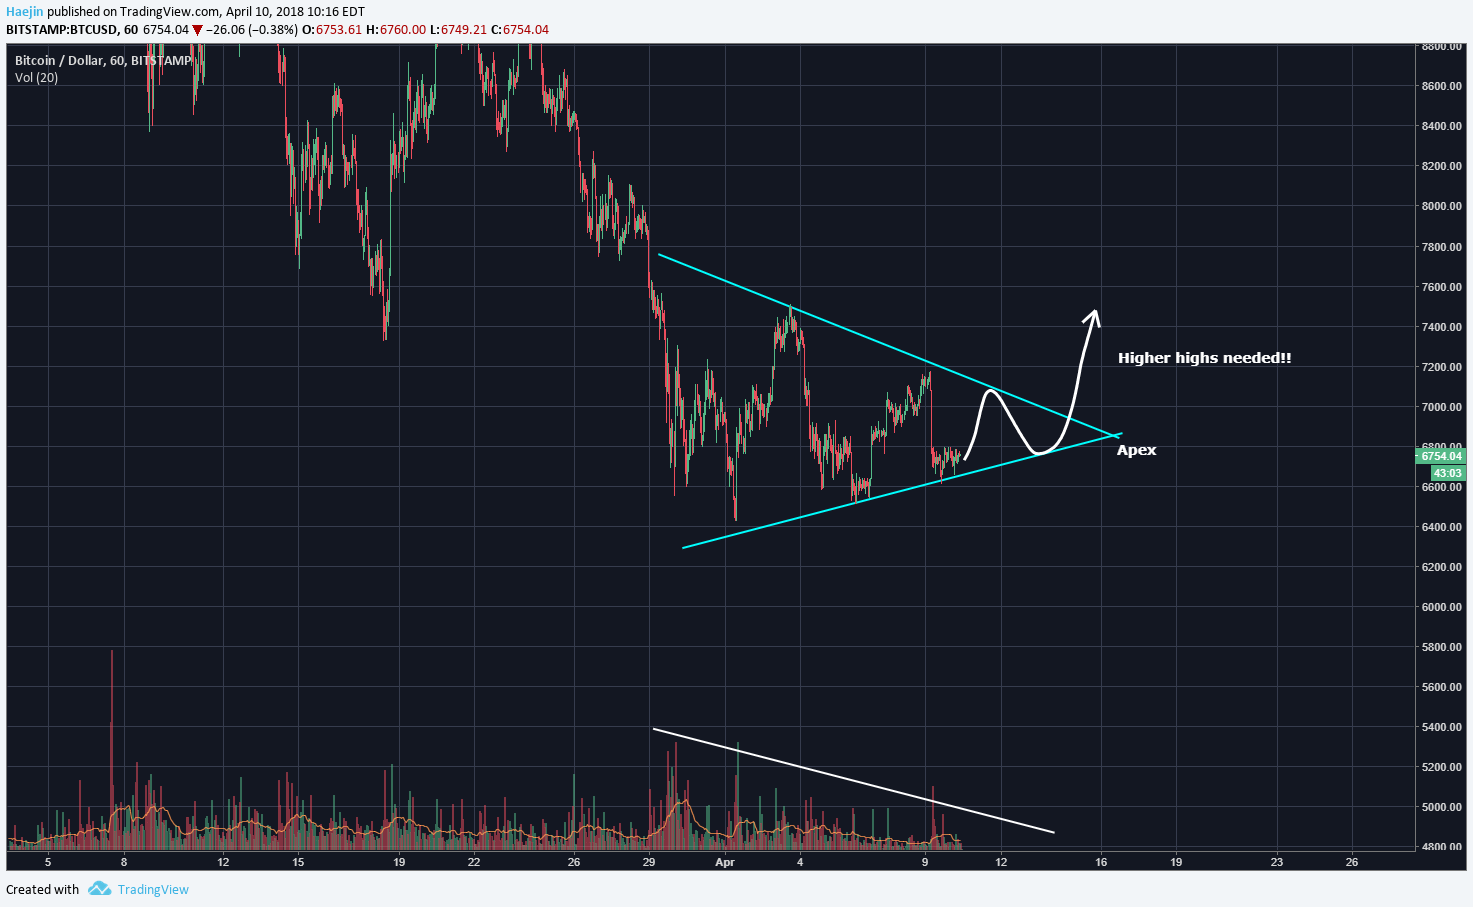
In looking at the short term chart of Bitcoin (BTC), a series of higher lows and lower highs can be seen and the lines show a symmetrical triangle pattern being formed. This pattern represents a consolidation phase without much indication into direction of breakout....it can literally break upwards or downwards and often the direction of breach is unknown until it happens. IF the breakout is upwards, Bitcoin (BTC) must start putting in some higher highs. It is the only way to establish a trend reversal start. Personally, I require two rounds of impulse motives as the first range of confirmation. The volume is declining and by the time price does get proximal to the apex; it'll likely trickle to almost nothing.
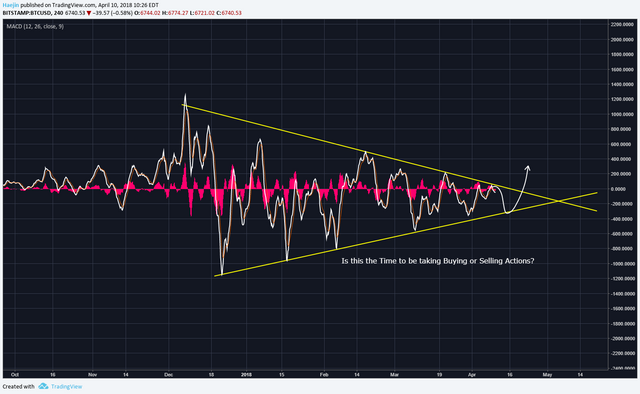
I'm giving bias to the upside because since the start of this correction in late December, sellers have repeatedly tried to strike down Bitcoin with all their might. The Seller strength can be measured in various ways and the below shows the MACD moving well within the contracting lines. The mobility of the MACD is very limited. Yes, while the MACD can break downwards; that'll require some serious renewal of seller mojo. BTC should get some degree of directional resolution within the coming week or so.
Legal Disclaimer: I am not a financial advisor nor is any content in this article presented as financial advice. The information provided in this blog post and any other posts that I make and any accompanying material is for informational purposes only. It should not be considered financial or investment advice of any kind. One should consult with a financial or investment professional to determine what may be best for your individual needs. Plain English: This is only my opinion, make of it what you wish. What does this mean? It means it's not advice nor recommendation to either buy or sell anything! It's only meant for use as informative or entertainment purposes.
Please consider reviewing these Tutorials on:
Elliott Wave Counting Tutorial #1
Elliott Wave Counting Tutorial #2
Elliott Wave Counting Tutorial #3
Laddering and Buy/Sell Setups.
Laddering Example with EOS
Tutorial on the use of Fibonacci & Elliott Waves
@haejin's Trading Nuggets
Essay: Is Technical Analysis a Quantum Event?
Follow me on Twitter for Real Time Alerts!!
Follow me on StockTwits for UpDates!!
--
--


That's interesting. I wonder how long the stability will last. Crypto sure is volatile.
Post and images not showing because of low ratings? Whatever the reason for the hate I do not understand other than maybe jealousy. I've been following @haejin for a while and I have never heard him say anything other than his opinion of technical analysis. As far as I can see this is a bunch of unnecessary drama.
Agreed.....
To understand the hate you have to understand the flaws in Steem blockchain. The 'reward' system is based on who has the most money. Haejin makes a shit ton of cash on Steem because guys like you and me enjoy his TA. The other whales want more money for themselves so they downvote at the last minute to stop Haejin from getting a payout. I like steem but it has some major flaws that will need to be addressed to get mainstream adoption. Not trying to get subs, as I am taking a break from posting now, but here is an article I wrote in talking about the witch hunt Haejin is under. https://steemit.com/life/@guntotnhippie/haejin-berniesanders-and-randomwhale-oh-my-a-steem-failure
How To Know if a Trend will Continue or Reverse! https://steemit.com/bitcoin/@investingtips/tutorial-how-to-know-if-a-trend-will-continue-or-reverse
Price has been just basing (yellow rectangle) the last couple of days, stay patient.
this is a really nice update. keep the good work up
I like this bitcoin
Thanks for sharing cryptocurrency news
I love blockchain
I appreciate your cryptocurrency news
Look at the second chart (closer view) of CryptosRocket's last btc TA... its from 11 days ago and it shows the last wave hitting 7.2k and going down... Exactly as it actually happened today!!! Check it out: http://cryptosrocket.com/btc/2018/03/29/lets-see-the-big-picture-and-whats-next
Could this be the bear scenario?
big ass descending triangle...that's exactly what I'm seeing! However @haejin just ignores it :) I would be careful trusting his TA mate
Descending wedge is a bullish correction lol
You have to have ABC corrections between each point that touches a line. The first line coming up isn't very three wavish. Also the triangle starts by hitting the first point at the top of the triangle. Please refer to Elliott Wave Theory book on what bull and bear triangles look like. The triangle that you have showing would first touch the bottom on the last low that we had (i think it was around $5800). If your triangle is correct then that would be a bull indicator suggesting that we are at the apex of the triangle. Triangles can also show something that you may think is there but a larger trend decides otherwise. That is why it's important to know where you are at from a macro level.
Elliott Wave principle is almost an art form as you really need to understand the formations from a quantum level as there is morphing that happens that can change the outcome. If you don't know how to read the changes and counts then you get lost fairly fast.
Haejin is a master at it that I can tell you. I am getting much better and just made good profit on XVG thanks to Haejin for teaching Elliott Wave principle.
Great article, thanks for sharing. I've hit the upvote button for you!
If you are looking to get hold of some crypto without investing or mining, look into https://www.crowdholding.com. They are a co-creation platform were you get rewarded for giving feedback to crypto startups on the platform. You can earn Crowdholding's token as well as DeepOnion, ITT, Smartcash and many other ERC-20 tokens.
Yeah just breaks this level