Bitcoin (BTC) Mid-Day Update: Bitcoin Misery Index (BMI) Flashes a Buy Signal

SUMMARY
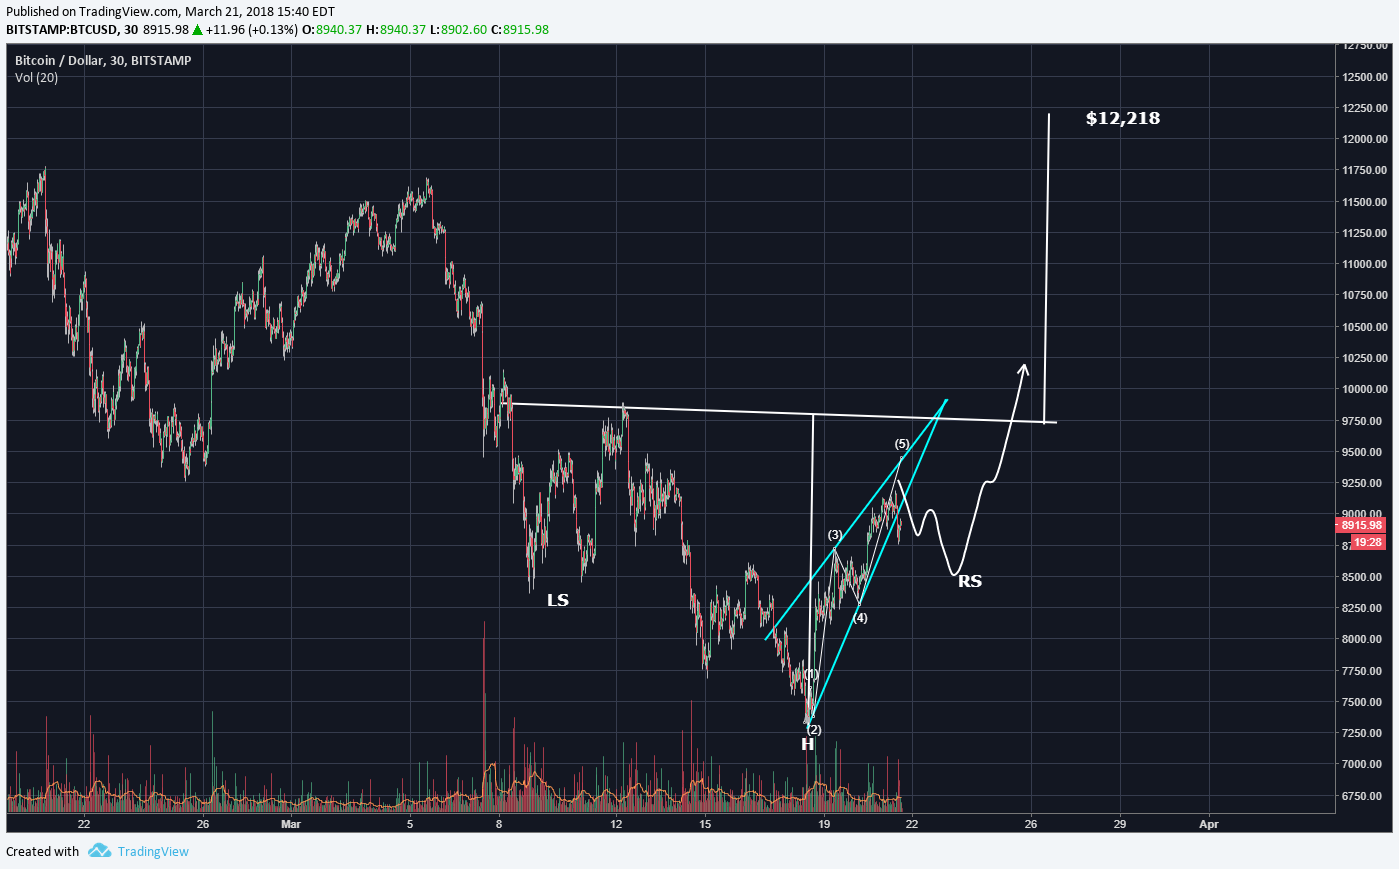
Bitcoin (BTC) seems to be tracking the pathway put out in this morning's short term update. Price has dipped below the blue upward pointing wedge. The Right Shoulder (RS) pattern formation remains in the process of completion and likely most of today and night will work on that.
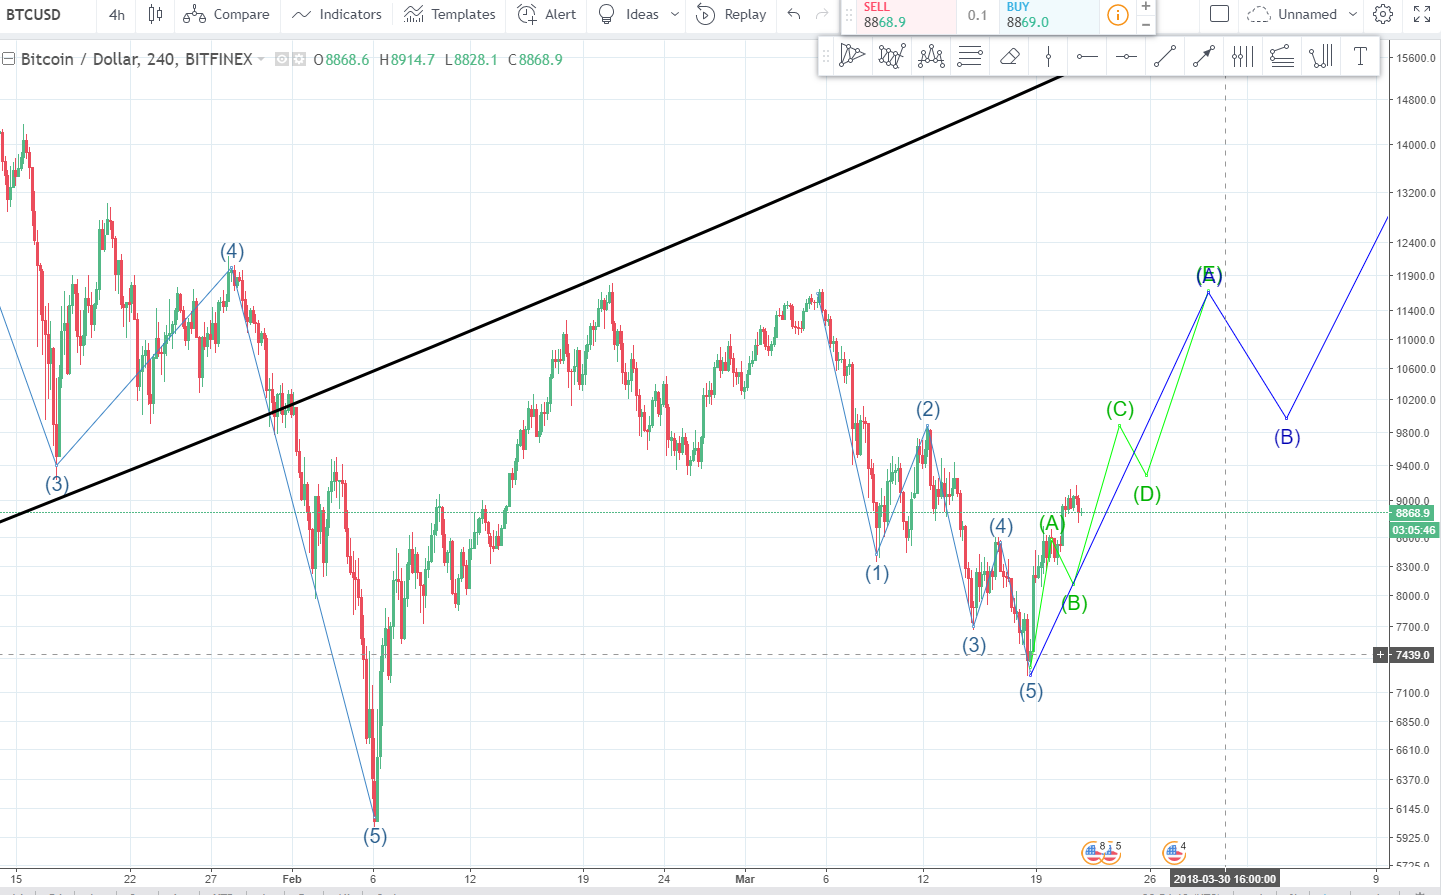
From the larger perspective, the blue Wave D is still in progress and blue Wave E is projected to be a third wedge pattern.

The daily MACD is at the point of contact between the white 12 day and the red 26 day moving averages. Further upside is needed to enable the cross upwards for a buy signal.

The below is called the Bitcoin Misery Index (BMI) put out by Tom Lee from FundStrat. The BMI was recently registered at a near all time low of 18.8. The buy signal is when BMI is below 27 and each time this level was attained, prices were much higher 3-4 weeks later. It's a very good contrarian indicator.

(Source: FundStrat; Tom Lee)
Legal Disclaimer: I am not a financial advisor nor is any content in this article presented as financial advice. The information provided in this blog post and any other posts that I make and any accompanying material is for informational purposes only. It should not be considered financial or investment advice of any kind. One should consult with a financial or investment professional to determine what may be best for your individual needs. Plain English: This is only my opinion, make of it what you wish. What does this mean? It means it's not advice nor recommendation to either buy or sell anything! It's only meant for use as informative or entertainment purposes.
Please consider reviewing these Tutorials on:
Elliott Wave Counting Tutorial #1
Elliott Wave Counting Tutorial #2
Elliott Wave Counting Tutorial #3
Laddering and Buy/Sell Setups.
Laddering Example with EOS
Tutorial on the use of Fibonacci & Elliott Waves
@haejin's Trading Nuggets
Essay: Is Technical Analysis a Quantum Event?
Follow me on Twitter for Real Time Alerts!!
Follow me on StockTwits for UpDates!!
--
--


Thanks for the Bitcoin Misery Index, very interesting!
Does anybody know how it is calculated?
kinda like Body Mass Index im guessing...
How is BMI calculated
These analysis fail so many times. The market is just too uncertain these days.
Here is my analysis/ perspective on Bitcoin right now: Why I Believe The Bull Move For Bitcoin Failed, and We Will Continue Down!
I heard a lot of people using in stock markets. But Don't know whether it is applicable to crypto.
I agree. I think because crypto volume currently is so low, its too easily manipulated by news or whales. When our volume was at our peak in Dec-Jan, we saw the price follow elliott wave trends, but unfortunately not now. Furthermore trading analyst have such varied opinions now, its hard to consolidate. I would say still keep following the analysts but from more than one source, and when we see unity in the predictions, then we know we are heading in the right direction.
I have seen some where that 40% of Bitcoins are in the hands of only 1000 people...they can drive the market in the way they want. In that no analysis work.
I wish you MAAAAAAASSSSSSIVVVE PROFITS!!
Who can give feedback on this please?
I seen someone else post a very similar count and it does look good even though I'm not big on Elliot Wave Theory... I do believe we go down further yet and so you could very well be right with that count :) @leventuzun
:) thanks..
I think you might be interested in this one too, just to show you a finished cycle:
Go to tradingview.com and search for Amazon (AMZN)
Put it on a Weekly chart and go all the way back to 1999 - 2002 (auto)
Check out april 2001 and oktober 2001
Overall, look how similar the chart looks with BTC (althoug things now aday's happen a lot faster)
Leventuzun
Bitcoin has been sideways since Mid Jan. If it breaks $6000, I agree with your chart the price goes lower. However, if it breaks $12000, the price will go up. I don't see it going below $6000. I believe if it was to get this low, the buyer would step in because they would see that price level as being a huge discount. I hope this helped.
Thoughts???
Thanks!
I disagree with your wave positions. If it helps at all, mine looks like this. (Done a day back so not everything lines up nicely). Hope that helps.
Thanks for the perspective.
Doesn't make sense: Your green A to B already calls you out on your own chart
As you can see from reality, my thumbsuck prediction is far exaggerated. I guess it also depends of what sort of term you're looking at. I tend to invest long-term and I don't swing trade, so little fluctuations in price don't bother me.
I wish you MAAAAAAASSSSSSIVVVE PROFITS!!
This doesn't help, but thanks.
hey there click on my link to earn 2000 per month free vote and tell me if you like it
https://steemit.com/money/@wolf92/easy-job-from-home-earn-at-least-2000-dollers-per-month
Please advertise more on @Haejin's blog. Don't use the promotion section. That cost you SBD.
hey there click on my link to earn 2000 per month free vote and tell me if you like it
https://steemit.com/money/@wolf92/easy-job-from-home-earn-at-least-2000-dollers-per-month
Please advertise more on @Haejin's blog. Don't use the promotion section. That cost you SBD.
Great crypto currency post
I love it your every Post
Thanks for sharing......
on trading view, magicpoopcanon had an interesting analysis of the head and shoulders at the all time high area. though the neckline was broken it reversed up to 17k, which he termed a 'head test' that never reached the head, and then we started going down. then we had that recent big inverse head and shoulders (head being $5900) that didnt break that neckline around 11.7, and noted (via his chart) showing the 7200 area looks like another head test which again didn't reach, which could still leave that larger iH&S in play. i thought it was an interesting observation. much easier when visually looking at his chart. wonder if you could comment on that if you had any thoughts.
We don't need a chart for Bitcoin. Bitcoin will always be good! Get in on the party now.
I wish you MAAAAAAASSSSSSIVVVE PROFITS!!
Thank you... the same here.
Buy and hold signals are evident
I don't see that third wedge pattern forming. I guess tell will tell if I am correct.
I wish you MAAAAAAASSSSSSIVVVE PROFITS!!
How much does it cost to learn Elliott wave strategy?
Doesn't need to cost anything, just watch youtube videos, read articles, practice on tradingview.com !
Can you please suggest some good channels or sites to learn this. Investopedia is giving training on this but not free.
You-Tube:
Crypto AMD (chart)
Trade Devil (chart)
Financial Freedom (chart)
Trader of Futures (chart/info)
Doug Polk Crypto (info)
The Crypto Lark (info/ICO)
Alessio Rastani (chart)
Gregory Mannarino (Economy/BTC)
Ivan on Tech (info)
Thank you very much!
22.00 Time, can also pay in hours.