Nextera Energy (NEE): Is It a Wave 3 or Wave 5?

SUMMARY
Note: Today is the very last day for Bitcoin Morning Update on Steemit because all Crypto Analysis and requests will be moved to the BitcoinLive platform which will launch tomorrow, June 4th!! To Signup for the BitcoinLive limited Founding Membership slots, use this link: https://get.bitcoin.live/haejin/
__
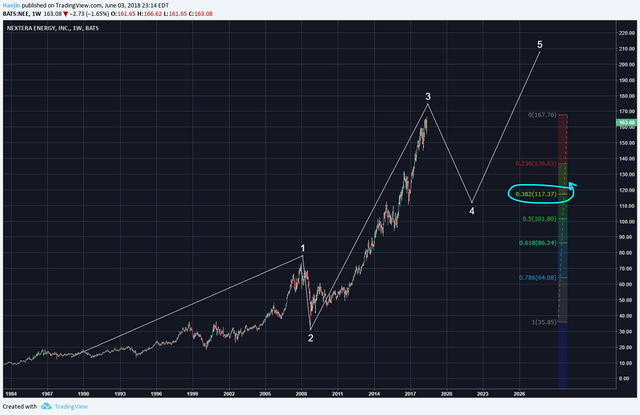
Beginning Ellioticians often have a difficult time to discern when to label the coming peak as a wave 3 or a wave 5. The below chart of Nextera Energy (NEE) shows a similar instance. Many newby technical analysts would call the white 3 a 5 but best to discern such clarification is through subwave labeling. It's like drilling down to the finer details to determine which wave label is the most ideal. IF this label is correct, then there is a requisite wave 4 correction dead ahead and that could decline 38% or so but can't overlap with the peak of 1.
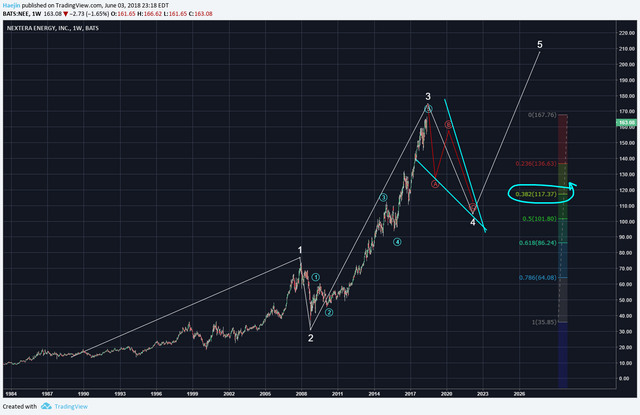
The subwaves of white 3 are shown in blue and the five wave up sequence seems pretty solid. That is the best way to qualify higher degree of trend labels. That means one must gain proficiency in being able to label actionary and all variations of reactionary waves. The white wave 4 is also likely to be an ABC sequence and this coudl also coincide with a downward wedge pattern as shown by the blue lines. Once complete, the way will be cleared for white 5 to bring about all time new highs.
Legal Disclaimer: I am not a financial advisor nor is any content in this article presented as financial advice. The information provided in this blog post and any other posts that I make and any accompanying material is for informational purposes only. It should not be considered financial or investment advice of any kind. One should consult with a financial or investment professional to determine what may be best for your individual needs. Plain English: This is only my opinion, make of it what you wish. What does this mean? It means it's not advice nor recommendation to either buy or sell anything! It's only meant for use as informative or entertainment purposes.
Please consider reviewing these Tutorials on:
Elliott Wave Counting Tutorial #1
Elliott Wave Counting Tutorial #2
Elliott Wave Counting Tutorial #3
Laddering and Buy/Sell Setups.
Laddering Example with EOS
Tutorial on the use of Fibonacci & Elliott Waves
@haejin's Trading Nuggets
Essay: Is Technical Analysis a Quantum Event?
Follow me on Twitter for Real Time Alerts!!
Follow me on StockTwits for UpDates!!
--
--


Would you be able to do some technical analysis on penny stocks (under $5)?
Wish you succes at bitcoin live. Pity so many things seem to bein closed groups
Nextera energy to the moon!
felicidades, muy buena información