General Dynamics Corp. (GD): A Cyclical Wave 3 Top

SUMMARY
Note: For anyone who missed the BitcoinLive Information Webinar, here is the replay link: https://www.youtube.com/watch?v=32l40SNYOp4
As of June 4, ALL Crypto Analysis will be posted on the BitcoinLive channel and Steemit will be dedicated for Equity, Commodity and Options Analysis. To Signup for the BitcoinLive limited Founding Membership slots, use this link: https://get.bitcoin.live/haejin/
__
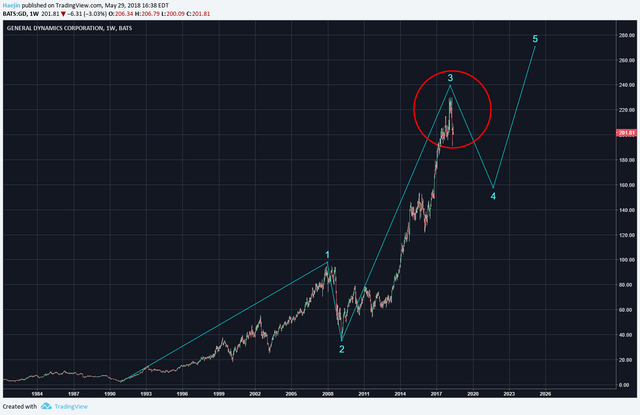
The weekly chart below of General Dynamics Corp. (GD) shows that price is nearing or have already placed a cyclical degree of trened wave 3 (red circle). As you might have noticed, many equity charts are either already in corrective mode or are entering into it. It's certainly not a crash scenario, but wave 4 corrections at cycle degree usually coincide with stagflation.
The subwaves of blue 3 show that it's pretty complete (white). White wave 2 was a symmetrical triangle and white 4 alternated to a simple abc type. The blue wave 4 could take the complex correction route given that blue 2 was simple. Equities abide much better to this rule of alternation between waves 2 and 4 than Cryptos.
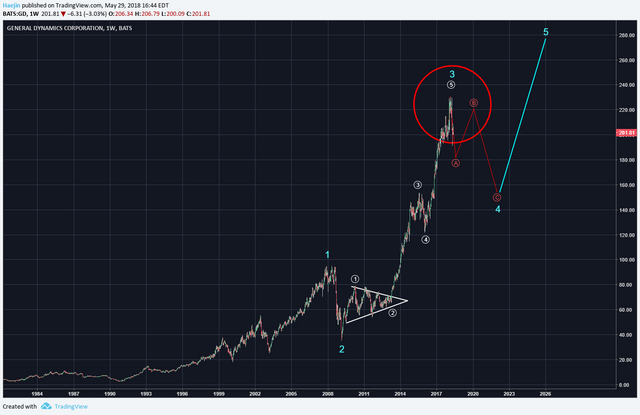
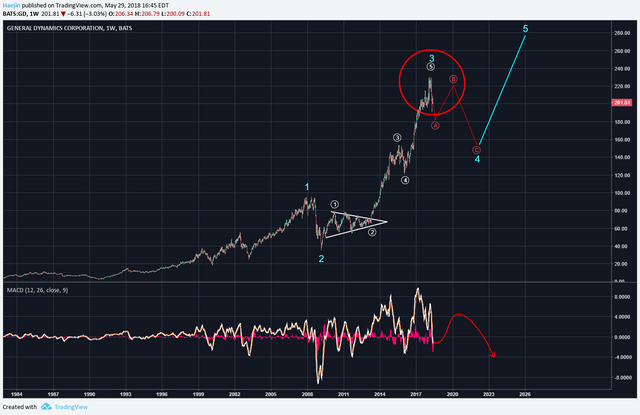
The ABC for blue 4 should hit the first cluster of support and that about represents 0.38 Fib level. The MACD can be expected rise for the B wave bounced. The red C decline could catch many by surprise. When is the best time to buy? Terminal end of corrections. Are at the terminal end or beginning?
Legal Disclaimer: I am not a financial advisor nor is any content in this article presented as financial advice. The information provided in this blog post and any other posts that I make and any accompanying material is for informational purposes only. It should not be considered financial or investment advice of any kind. One should consult with a financial or investment professional to determine what may be best for your individual needs. Plain English: This is only my opinion, make of it what you wish. What does this mean? It means it's not advice nor recommendation to either buy or sell anything! It's only meant for use as informative or entertainment purposes.
Please consider reviewing these Tutorials on:
Elliott Wave Counting Tutorial #1
Elliott Wave Counting Tutorial #2
Elliott Wave Counting Tutorial #3
Laddering and Buy/Sell Setups.
Laddering Example with EOS
Tutorial on the use of Fibonacci & Elliott Waves
@haejin's Trading Nuggets
Essay: Is Technical Analysis a Quantum Event?
Follow me on Twitter for Real Time Alerts!!
Follow me on StockTwits for UpDates!!
--
--


Another great read my friend!
You make a very interesting analysis, I congratulate you.
I should keep it simple I guess.