MonaCoin (MONA): WXYXZ Complex Correction into April 23rd

SUMMARY
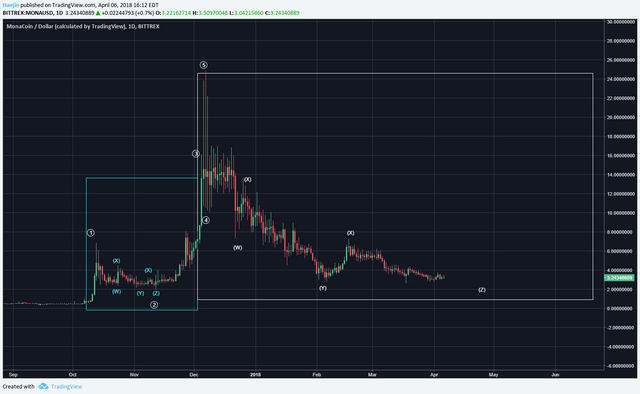
Complex corrections best fit the Altcoin requirement of an extended, long, churning and sideways moving price action. Of the horizontal move is the last but also the longest component of an Altcoin correction. The chart for MonaCoin (MONA) shows that the second fractal (white) is a much larger cousen of the smaller blue one. The white Z wave of the second fractal is proportionately projected for the last days of April.
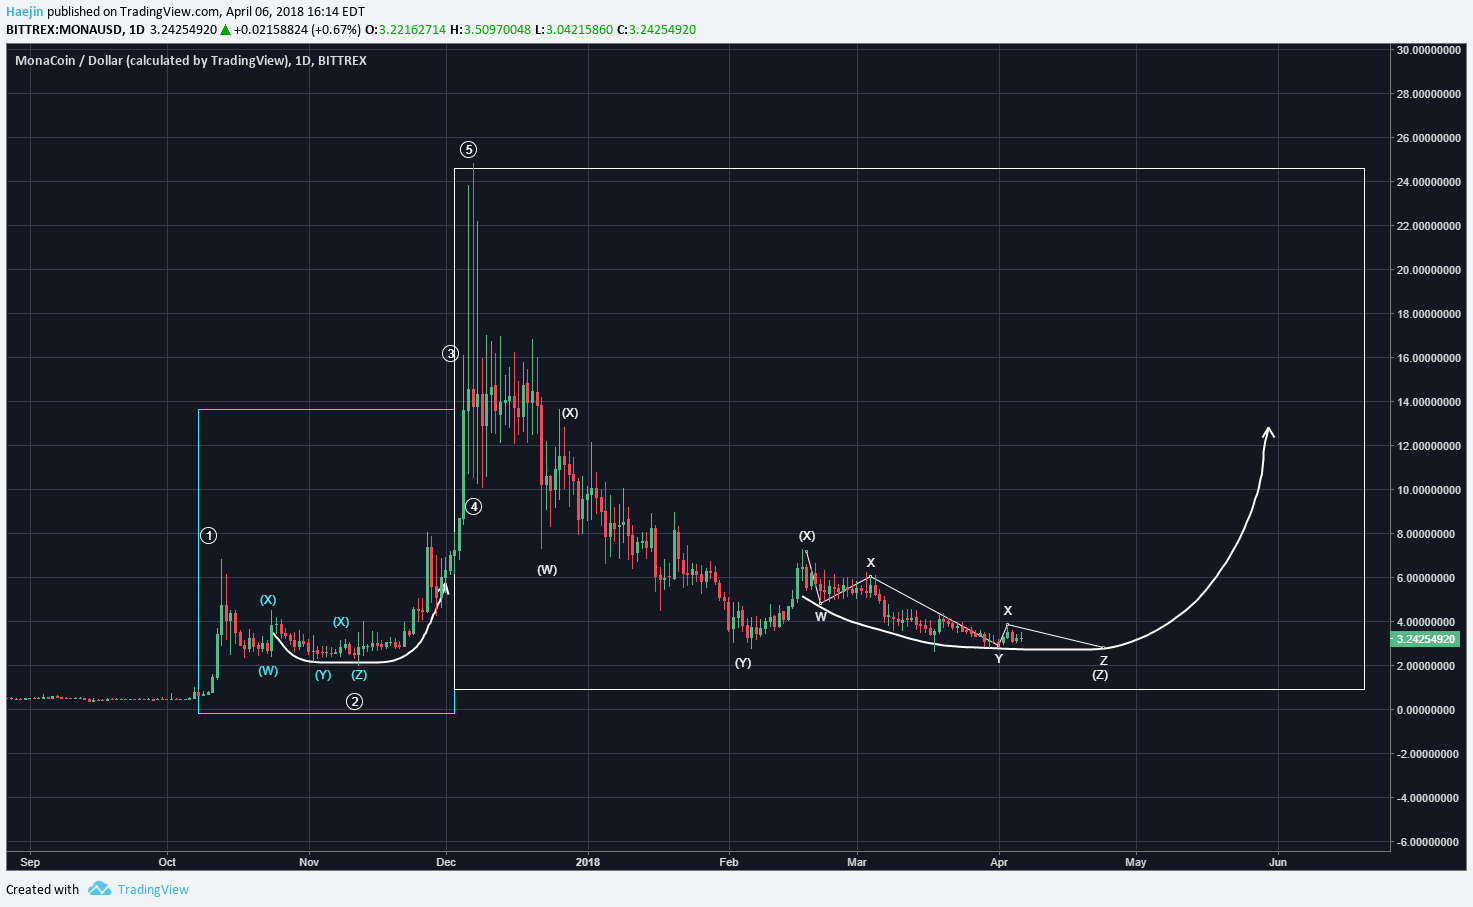
Subwave closeup shows the correlation in sideways price movement proportion to the smaller fractal and time extension. The basin phase is still in progress. Once complete, a reversal is likely as shown by the white arrow pathway.
Legal Disclaimer: I am not a financial advisor nor is any content in this article presented as financial advice. The information provided in this blog post and any other posts that I make and any accompanying material is for informational purposes only. It should not be considered financial or investment advice of any kind. One should consult with a financial or investment professional to determine what may be best for your individual needs. Plain English: This is only my opinion, make of it what you wish. What does this mean? It means it's not advice nor recommendation to either buy or sell anything! It's only meant for use as informative or entertainment purposes.
Please consider reviewing these Tutorials on:
Elliott Wave Counting Tutorial #1
Elliott Wave Counting Tutorial #2
Elliott Wave Counting Tutorial #3
Laddering and Buy/Sell Setups.
Laddering Example with EOS
Tutorial on the use of Fibonacci & Elliott Waves
@haejin's Trading Nuggets
Essay: Is Technical Analysis a Quantum Event?
Follow me on Twitter for Real Time Alerts!!
Follow me on StockTwits for UpDates!!
--
--


@haejin what do you think about this?
( )
)
On the top chart the wave 4 is lower than the peak of wave 1 it appears, and that would be breaking one of the EW rules, no?
correct, but idk. I feel like theres a small room for lenience. When you switch it to a line chart rather than a candle stick chart it doesn't show the extremities of the markets pushing the prices up for sometimes just a few seconds.
Like this:
sometimes when it looks like it makes sense but the rules are broken I just take a look here to see on the line chart. BUT, Idk thats just me and I heard someone else try this. But hopefully @haejin can give us some insight on this as well?
Where is @Haejin's office located at? I would like to come sign up for a one on one personal coaching session? I need his name & location where his business is located at. Please someone tell me where I can find this information at.
Did @Haejin die? No post in 5 hours!!!
Wow..
hope be up
even though it's haejin, i gotta give an upvote for mona!!!!!!!!!!!
Does the arrow indicate target ($13) or just an indiction of probable pathway?
I noticed you do not answer questions in the comments anymore. Thanks anyway
Where is @Haejin's office located at? I would like to come sign up for a one on one personal coaching session? I need his name & location where his business is located at. Please someone tell me where I can find this information at.
Wololo!
(RandoHealer has healed this post because your blog was targeted for healing due to malicious downvotes!)
All currencies recover in April of each year
we hope that
I keep hearing that but the historical BTC charts don't seem to really support it. I don't believe that 2 years of the last 9 is much of an indicator.
no pierdo la esperanza, que todo mejore
How does a post with 198 views get 269 upvotes?
Haejin has his own BOTS voting for him. 75% or more of the votes are from his own accounts!!!