Ethereum (ETH): MACD Temporary Pierce of lower Trendline Likely

SUMMARY
Note: For anyone who missed the BitcoinLive Information Webinar, here is the replay link: https://youtu.be/No4frLOz3UE
As of June 4th, ALL Crypto Analysis will be posted on the BitcoinLive channel and Steemit will be dedicated for Equity, Commodity and Options Analysis. To Signup for the BitcoinLive limited Founding Membership slots, use this link: https://get.bitcoin.live/haejin/
__
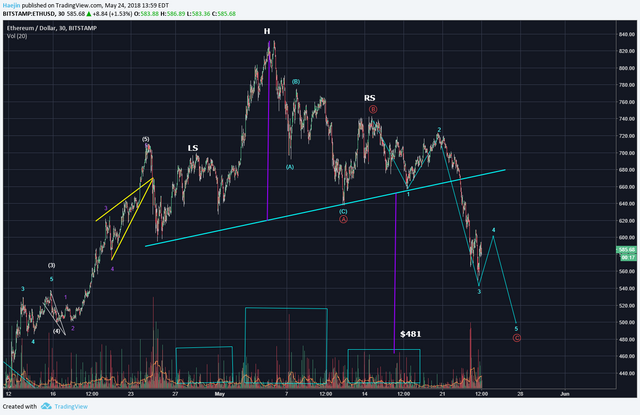
The H&S Top patern for Ethereum (ETH) is progressing as shown below. The red ABC outlines the projected correction towards $481 to $461 or so. That would equate the level of 0.78 Fib level retracement. Red A is sublabled with blue abc and red C with blue 1,2,3,4,5 of which wave 4 is likely in progress and 5 should aim for the 0.78 Fib zone.
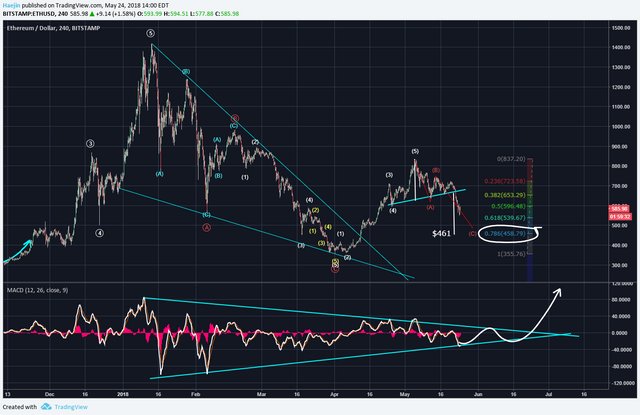
The longer term remains little changed. The red ABC is included to outline the minor, healthy correction towards 0.781 Fib (white circle). The MACD should turn up once red C is complete and until then, a temporary pierce of the lower blue trendline is likely.
Legal Disclaimer: I am not a financial advisor nor is any content in this article presented as financial advice. The information provided in this blog post and any other posts that I make and any accompanying material is for informational purposes only. It should not be considered financial or investment advice of any kind. One should consult with a financial or investment professional to determine what may be best for your individual needs. Plain English: This is only my opinion, make of it what you wish. What does this mean? It means it's not advice nor recommendation to either buy or sell anything! It's only meant for use as informative or entertainment purposes.
Please consider reviewing these Tutorials on:
Elliott Wave Counting Tutorial #1
Elliott Wave Counting Tutorial #2
Elliott Wave Counting Tutorial #3
Laddering and Buy/Sell Setups.
Laddering Example with EOS
Tutorial on the use of Fibonacci & Elliott Waves
@haejin's Trading Nuggets
Essay: Is Technical Analysis a Quantum Event?
Follow me on Twitter for Real Time Alerts!!
Follow me on StockTwits for UpDates!!
--
--


Looks good, Haejin.
Thanks Haejin. Would you mind posting the chart for STEEM? Thanks!
OK, i understand traders will only want to buy when momentum to the upside is the strongest which means any crossovers occurring under the zero line will be excluded
its very helpful post for me. thanks sir for this post.
Nice post
Gracias
I can't find 5 subwaves in 1st wave down because of the overlap.
Is it possible to mark it like this?