1/19/2017 The Market View and Trading Outlook
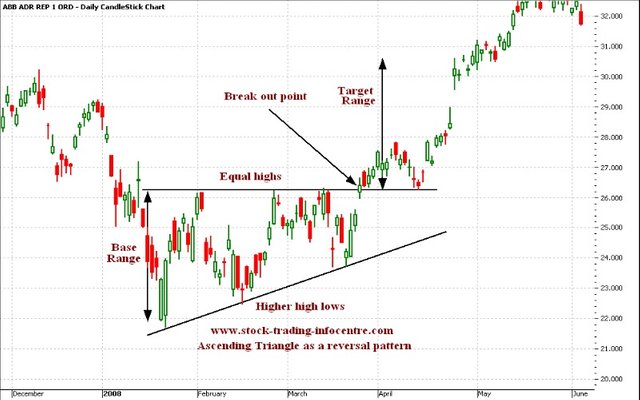
Well as expected BTC bounced the 21 period MA on the 2 hour around $10,800; a good thing as it showed us that there is (for the moment at least) good support at the $11,000 mark. Of even greater importance is that the bottom of last night has allowed us to connect the dots and reveal a potential ascending triangle/wedge; a generally bullish indicator that breaks to the good 70 percent of the time.
It also illuminated the fact that someone or some entity is hopefully steering us in the direction of a large upwards move by propping up the price as needed and accumulating low priced BTC at the bottom of the ranges. This became evident with a 1000 BTC buy order at exactly the wrong time at 0300 last night.
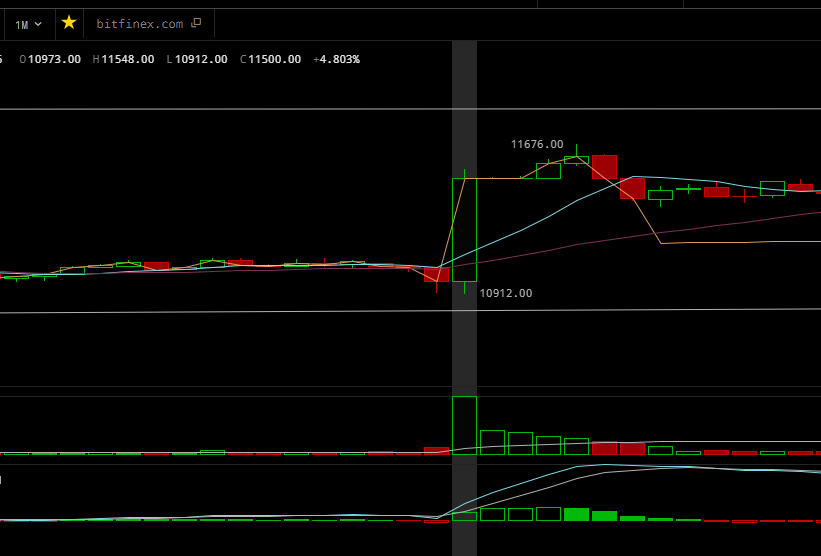

Influence of this buy is more apparent in the 3 min, in a selling cycle, attempting buying cycle failed, entering another selling cycle, MACD broke 0 South, 7 and 21 broke 77 South.. Big buy turns things around at exact lower range of the potential ascending triangle. Without this buy considerably slippage was in the cards.
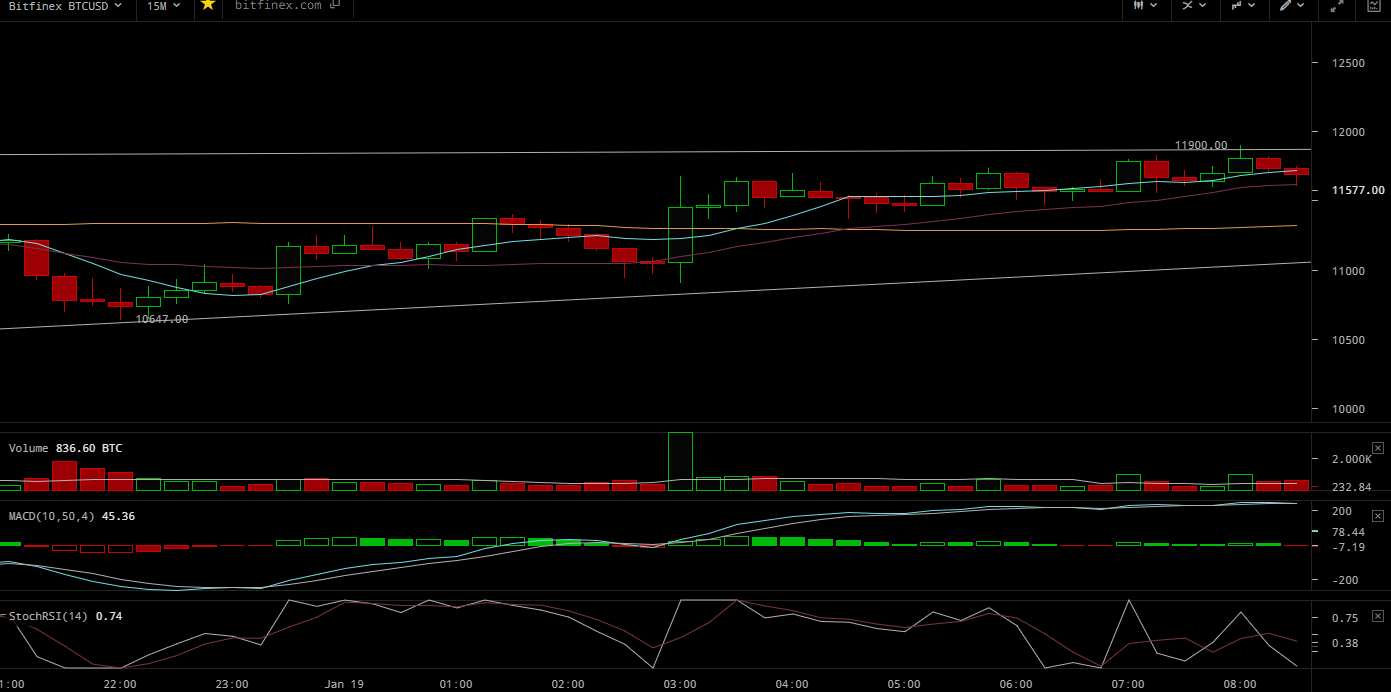
Influence of this buy on the 15 min; (histogram) previous buying period ended, selling period getting underway and gaining momentum, MACD heading South towards 0 again and looking to make a Negative MACD/Signal line cross for further bearish momentum. 7 starting to trend South toward the 21 and boom, a market buy for $11 million that saves the day and steers things to the North again.
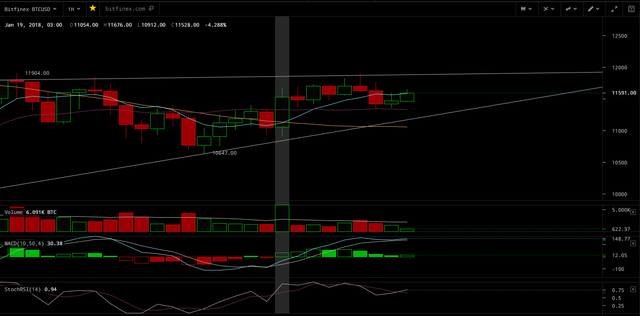
The effect on the hourly; (MACD histogram) failed buying period, entering a selling period, high volume sell off taking us south, then the big buy. Counters the selling period and give us just enough momentum to break the 7 MA back above the 77 and preserve the lower boundary of the triangle.
Overall the picture is not looking that bleak, though I have to remain objective and always conspiracy theory minded so as to be prepared to expect the unexpected.
Moving onto the non conspiracy theory riddled data.
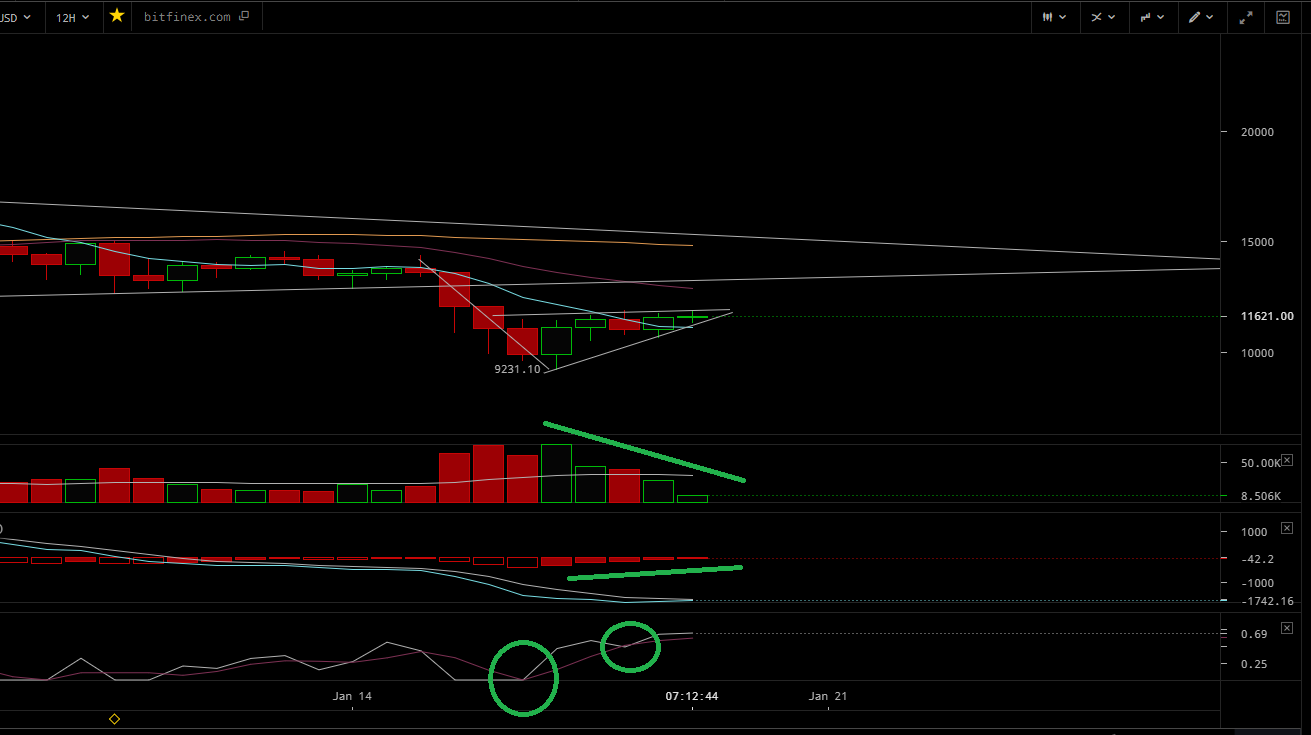
The 12 hour; while not totally bullish as we are not in the green as of yet, looks to have a selling period that my finally be closing out with the histogram hopefully going green in the near term. A 12 hour buying period is usually good for at least $500-$1500 swings to the upside.
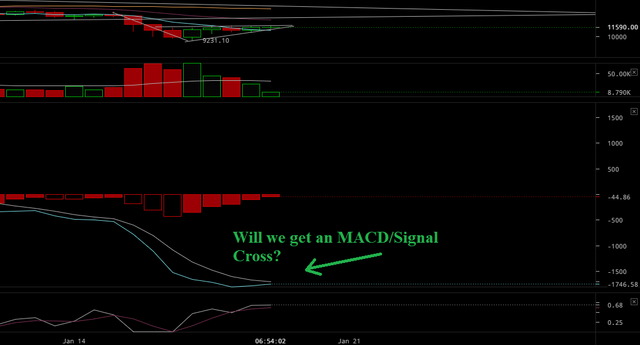
We do not have an MACD/Signal line cross yet, but the bowl is beginning to round out and it looks as though it may be a likely occurrence.
Price has bounced twice on the RSI and we are now above .50 in the .69 range and below .80; what many consider to be buying territory.
Crosses of the 50 level can be used as a buying or selling signal. When StochRSI crosses above 50 then buy, when StochRSI crosses below 50 then sell. ---Source: https://www.fidelity.com/learning-center/trading-investing/technical-analysis/technical-indicator-guide/stochrsi
If the potential ascending wedge/triangle holds the low range should now be $11,150-ish and that may be a good place to set a buy point if we have another mild pullback on the lesser time frames before making a push. Again, go to the charts, draw lines, do your research look at the volume, candles, MACD, RSI etc. and make your own decisions.
I may very well be wrong and that’s fine it’s my money to lose and as I have stated I lose trades all the time I just cut the losers short, let the winners run and am quite successful in the long run. That said, you have to enter the market somewhere if you wish to gain anything, don’t let fear of loss (emotion) keep you on the sidelines when indicators are showing a potential positive. In the long run missing an upwards move due to fear only further hurts your confidence and makes you that much more hesitant to enter later as you will continually second guess yourself. If you enter at the right time and it goes south just sell it.. you lose .0025 percent in a makers fee or $2.50 per $1000 sold.. big deal.. Much better than riding a loser straight into the dirt.
OBJECTIVITY ALERT
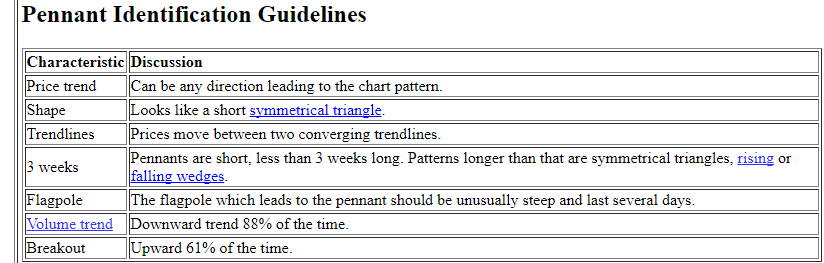
In order to remain objective the pattern could also be another “BEAR PENNANT”; just this time in a larger time frame.
If you go to my two hour analysis from: https://steemit.com/bitcoin/@pawsdog/1-16-2017-the-market-view-and-trading-outlook.
You have to accept that this is also a possibility though the top resistance line is a bit more flat in the current instance. Either way the lower support of $11,200 will tell us which way this is likely to go.
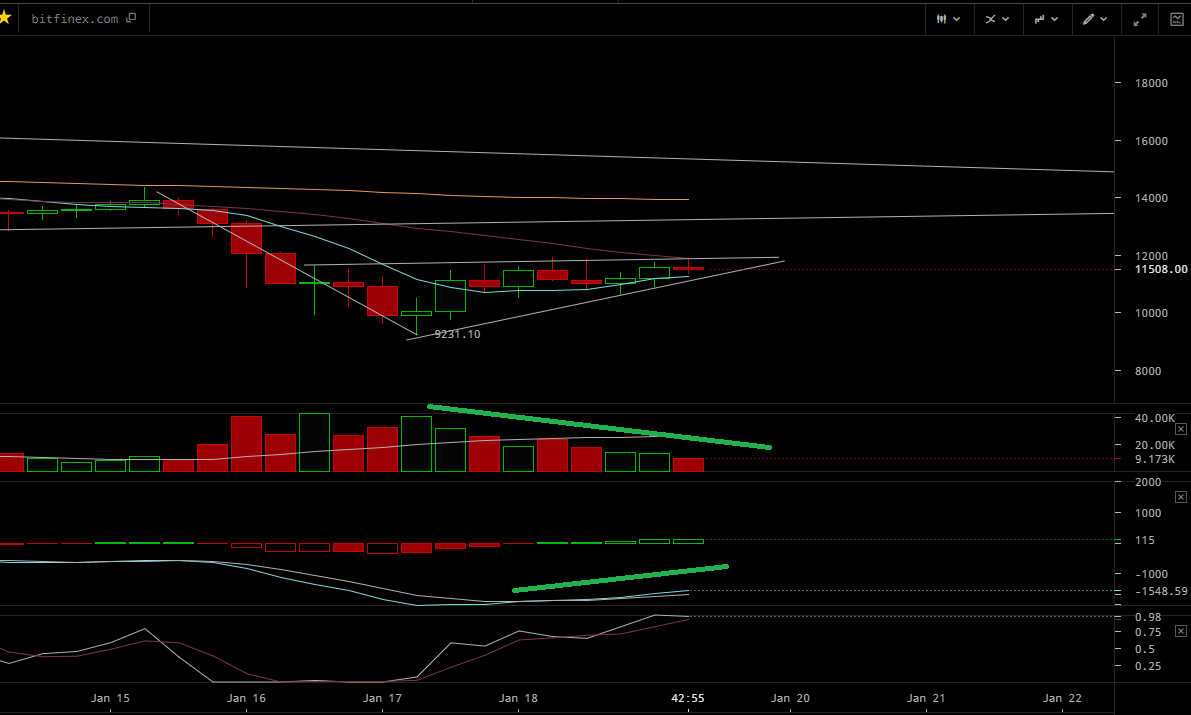
The 6 hour is more neutral at the moment than anything else, we are somewhat deep into a buying period on the MACD histogram, though enthusiasm is mehh.. The MACD is trending up which is good, though we have divergence that could stagnate prices. The RSI has us in overbought territory though we tend to remain here for a number of periods before crashing back down and it may bring about a follow on buying period. Volume tends to be drying up which works for a wedge or a bear pennant so that is neutral. No real information in regards to the moving averages, save the 7 is slowly inching towards the 21 and may cross. Regardless we are trapped in this wedge/ bull pennant and will have to see which way it breaks.
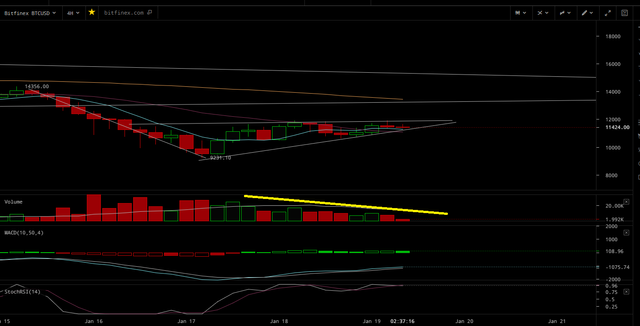
The 4 hour is the same story as the 6; dwindling volume, trapped in a potential bullish ascending triangle or bearish pennant, buying period though unenthusiastic etc. The one take away from this period is that we did have a 7/21 upwards MA crossover, which followed the 2 hour before it. Each lesser frame tends to (for the moment at least) be making slow but positive ground in terms of MA crossovers. That said the 7 crossed above the 21 at a decent upwards trajectory but is now listing slowly southward in direction. It may bounce the 21 and try for the 77 or may cross back under as a bearish indicator. Have to wait and see..
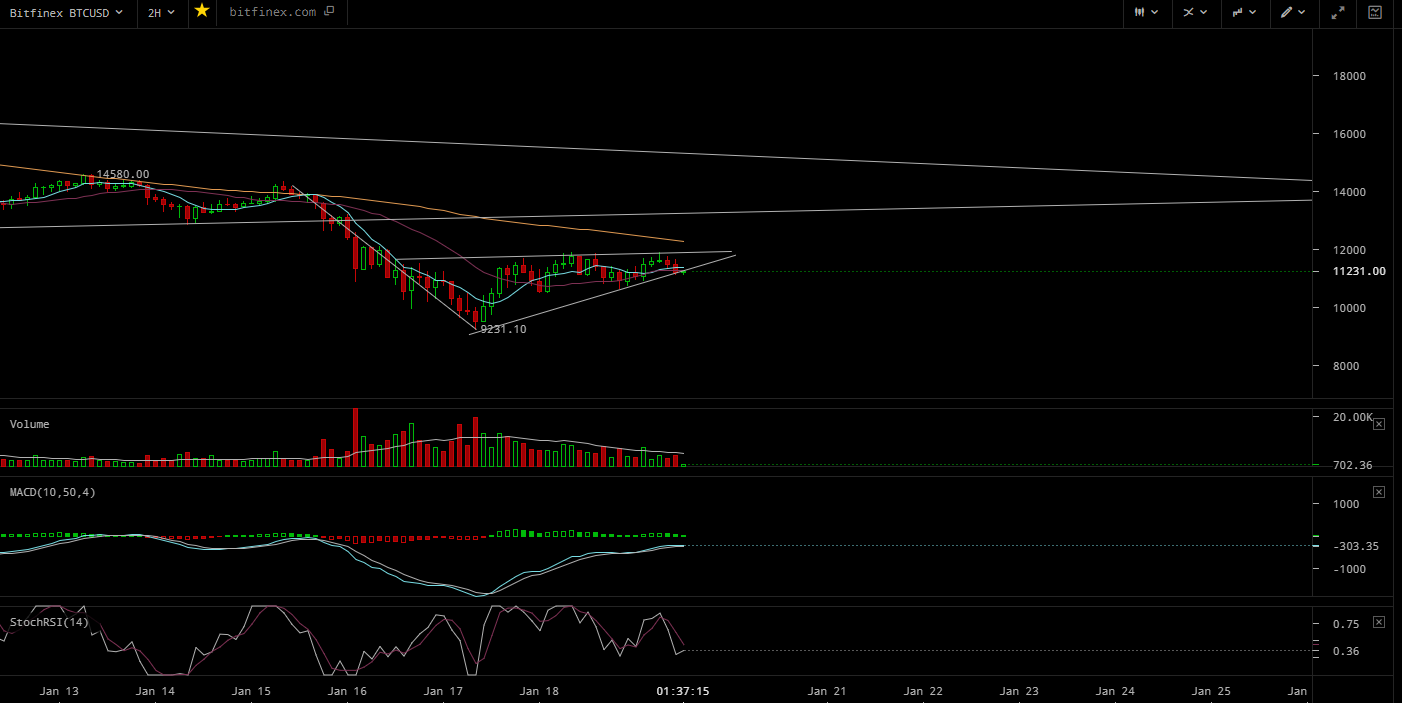
The 2 hour is flirting with danger according the histogram and may enter a selling cycle. The RSI is hovering around and just above .50 and the MACD is heading towards the 0 line where it may face resistance. This is a somewhat pivotal timeframe as it may provide the strength to hold the bottom or it may provide the momentum to crash the bottom. In this frame $11,300 or the 21 period MA is a key support level that price needs to close above. The 7 did cross above the 21, 2 days ago and has made one bounce from it so far (last night) we may be in for yet another bounce wherein price could test the 77. We may also be in for a flop where 7 cuts below the 21 again, the bottom of the pattern busts and we slide south in a big way. Either way price is still trapped in this bullish wedge or bear pennant and needs to break so we have some idea of what the longer term price action will be.
Again I am not advocating a buy or sell, that is for you to decide. I am simply pointing out potential patterns, key potential support and resistance levels and hopefully inspiring you to do your research and come to your own conclusions. For me at current the $11,200-ish level is key to determining what will likely occur next either up or down.
Below see included charting pattern examples and make your own decision.
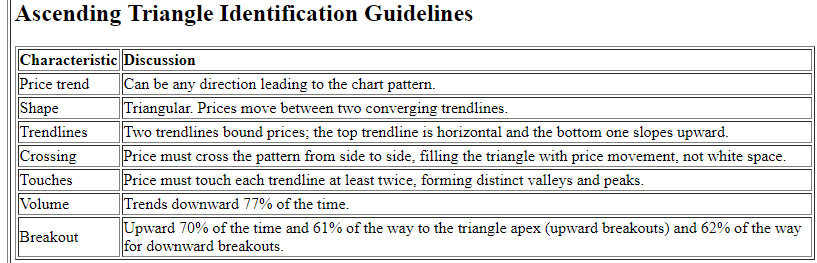
Ascending Triangle
Bear Pennant

My Previous Analysis:
https://steemit.com/bitcoin/@pawsdog/1-18-2017-the-market-view-and-trading-outlook
https://steemit.com/bitcoin/@pawsdog/1-16-2017-the-market-view-and-trading-outlook
https://steemit.com/bitcoin/@pawsdog/1-15-2017-the-market-view-and-trading-outlook
https://steemit.com/bitcoin/@pawsdog/1-14-2017-the-market-view-and-trading-outlook
https://steemit.com/bitcoin/@pawsdog/1-13-2017-the-market-view-and-trading-outlook
https://steemit.com/bitcoin/@pawsdog/1-12-2017-the-market-view-and-trading-outlook
https://steemit.com/bitcoin/@pawsdog/1-11-2017-the-market-view-and-trading-outlook
https://steemit.com/bitcoin/@pawsdog/1-10-2017-the-market-view-and-trading-outlook
https://steemit.com/bitcoin/@pawsdog/1-9-2017-the-market-view-and-trading-outlook
https://steemit.com/bitcoin/@pawsdog/1-8-2017-the-market-view-and-trading-outlook
https://steemit.com/bitcoin/@pawsdog/1-5-2017-the-market-view-and-trading-outlook

I've been away for a touch, but man these posts have gotten incredible! So much detail!
For those new to the game, was the $11M buy a deliberate move to prop up the market? Wouldn't a big player normally step into the market in chunks so as to not affect the price? Or would the player be so big that $11M is nothing to them?
Likely tossing a penny in the bucket to see what it did and how it would affect price then slowly sell out on the minnow run that followed if they did not like what they saw. It was a deliberate move and an odd one as price was heading down and the BTC could of been bought cheaper, but that may of really shaken faith and hurt the long term prospect if it was allowed to slide that far again. I again being conspiracy minded see us being steered in different directions all the time.. Again I may be totally wrong.. I just try to keep an open mind as to all the possibilities on the horizon.
check out ICX , whale manipulation with 16-20btc sell walls suppressing price .
NBT is the same... keeping price at $1
Nice post, i followed you, please follow back. :-)
Thank you for your comment :).. Your content appears to be original, nice job.. followed...
like the writing very much and I vote.Please do the same
Highly informative. Great stuff! Resteemed.
Thanks, I try to deliver good content.. Sometime I'm right, sometimes I'm wrong...lol