1/18/2017 The Market View and Trading Outlook
Will we recover or will we not? That is the question. At current we are battling the longer term moving averages in the lower frames. This is also potential bull trap territory to set up a further shakeout. Not saying that is the case, just that you have to be objective and avoid looking at the charts to see what you want to see. I remember the $2900 to $1700 crash and there were plenty of these events along the way to the bottom and even more in the $5000 to $3000 dive on both the crash and recovery side; even though the longer term trend was upwards and onwards. Moral of the story; avoid getting tunnel vision, stay objective and base your decisions on the data, not your feelings.
So onto the charts and being objective.
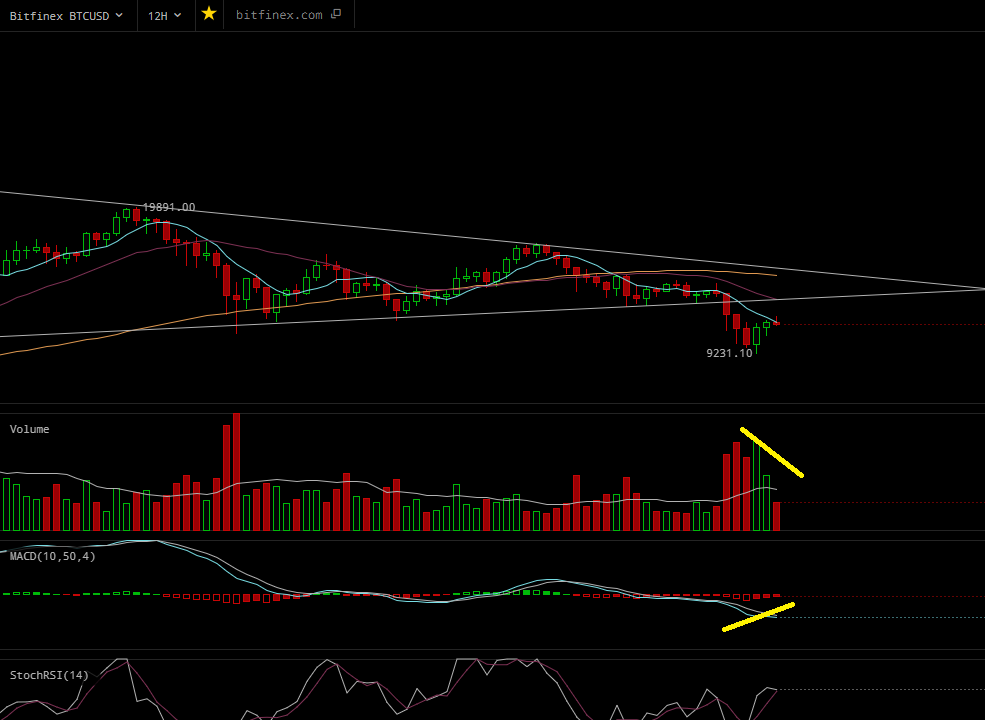
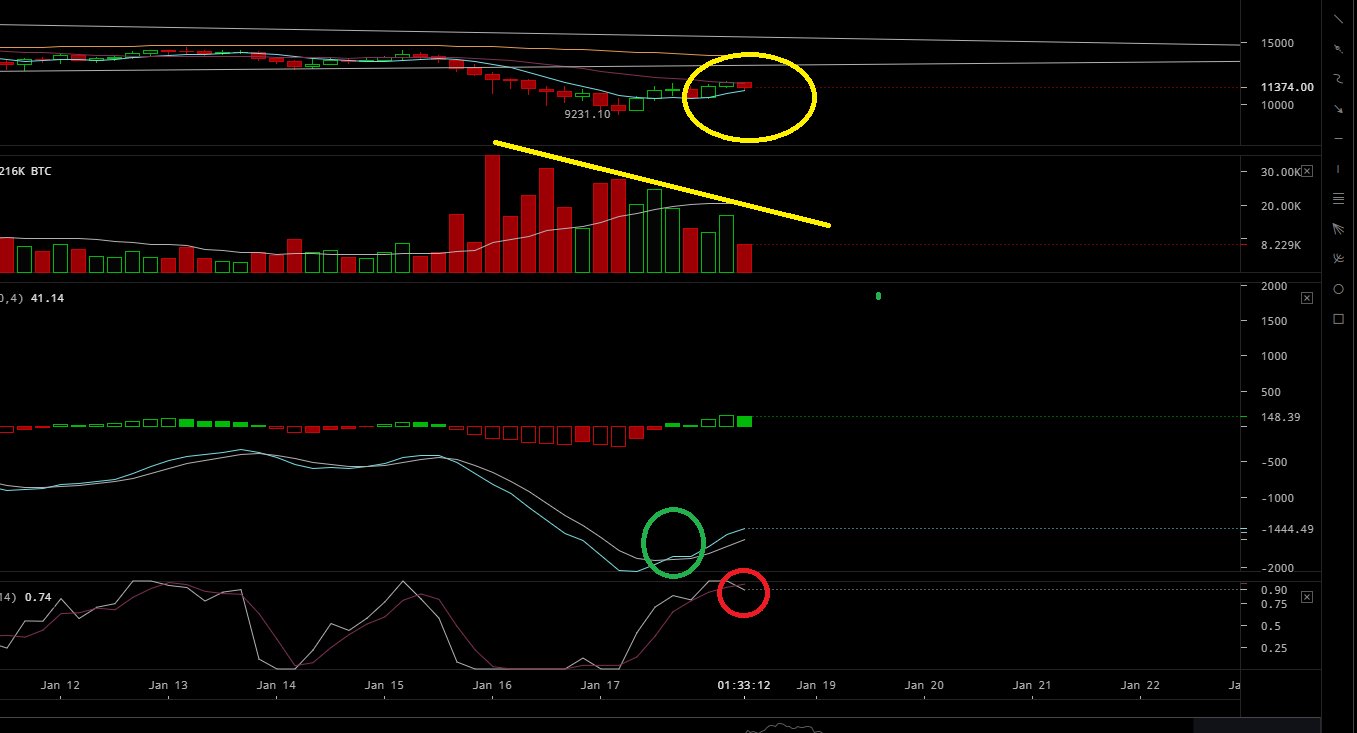
Not much to love in the 12 hour. Price is rising on declining volume (most often not a good thing) and we have no other solid technical indicators of a longer term trend reversal. We have an MACD Histogram that “may” be winding down on the seller side, but this has been the case 3 times since January 8th and all have instead reversed in favor of a follow on selling cycle.
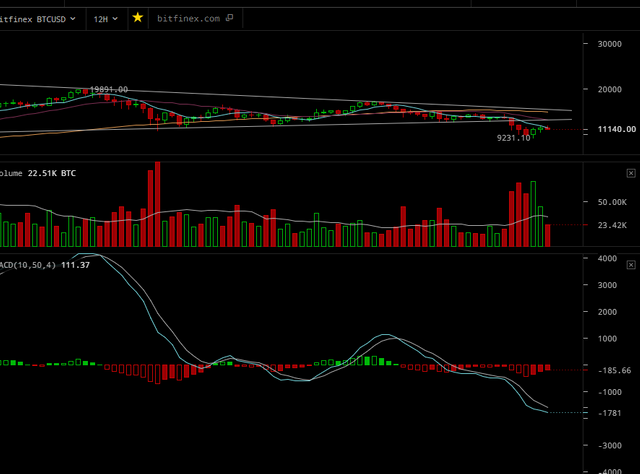
If we look strictly at the MACD, yes we are at historic lows @ -1776 but we are also coming off of historic highs of +4127, so there may still be some room for lower prices. The MACD/Signal line (while there is divergence indicative that price will have to either come up or remain at this level for some time) is heading south in rapid fashion and is not known for making sharp 90 degree turns to form a crossover in this time frame. Most often it forms a bowl shape prior to crossing over and signaling a buying frame.
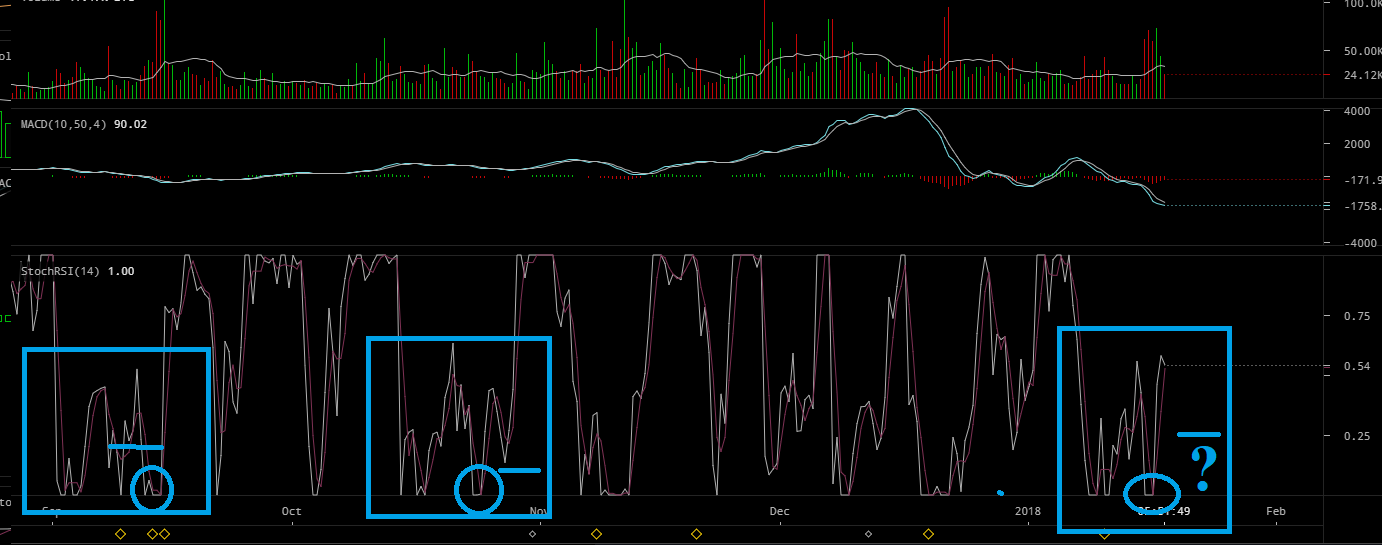
Looking at the RSI we are in somewhat neutral territory struggling to break the .50 with some more volatility left to play out. It’s really hit or miss with this indicator and the best I can do is compare it with previous periods and use how they played out as a weak attempt to forecast how this one may on the RSI. That said, I do not believe it is off to the races yet and we may get to play with $10,000 again.
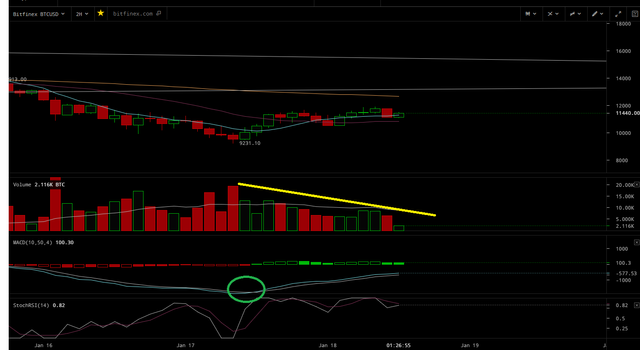
The 6 hour is the same as the 12 for the most part. Higher highs on lower volume, a somewhat messy RSI that looks to have stayed a bit to briefly in the oversold area, and is already entering the overbought area prior to an actual break out. We do have an MACD/Signal line cross in the lower range, which is good; however, there is still plenty of room at the bottom for another drop. If the current buying period comes and goes with little momentum and anemic volume expect us to take another hit. If the lesser frames can get it in gear and volume picks up commensurate with price then things could look better. At current the 6 hour is not really doing it for me. In terms of MA’s price is going to have to go $13,000 plus to pull the 7 over the 21 and based on the shaken faith of the masses I would more than likely expect a rejection of the 7 by the 21 at $12,288 and a potential recross to the upside further down the price line.
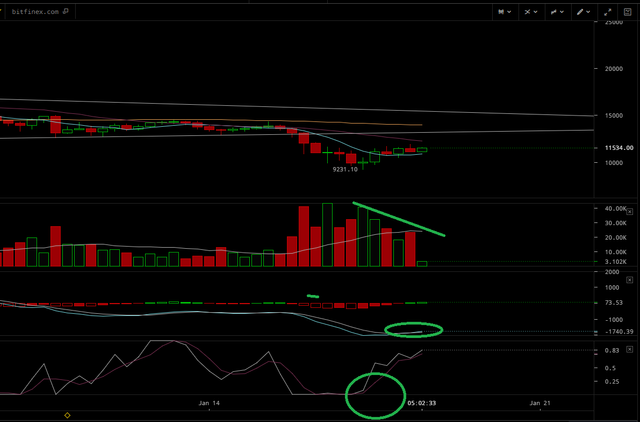
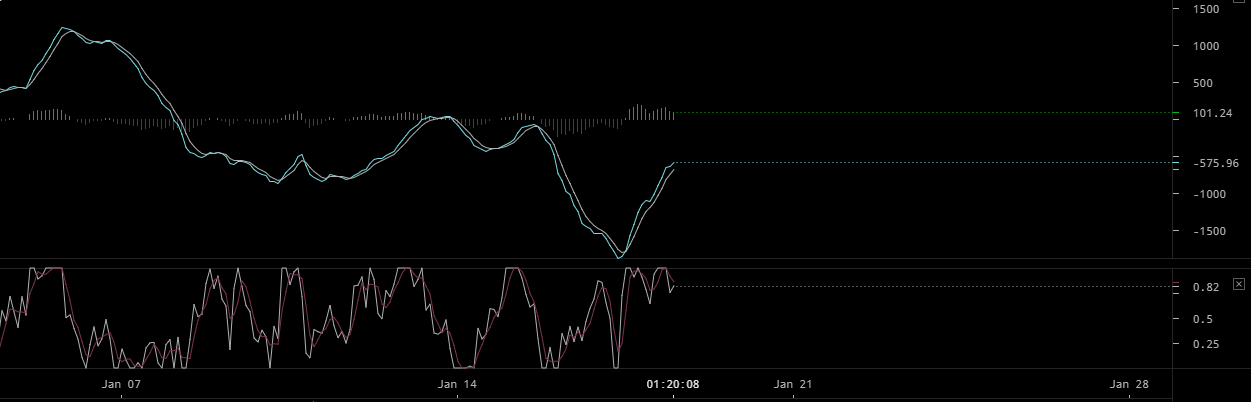
The 4 hour is a bit confused at the moment as to what it wants to do. Price up on lower volume again, we do have a solid MACD/Signal cross to the upside, but also a follow on RSI cross to the downside in near overbought territory; rough interpretation= sideways down to build juice for an up or fail. We also have our first solid bar on the histogram indicative of consolidation or increased selling pressure. There is potential for a 7/21 cross on the MA’s but just as much for a 7/21 rejection for a lower low. The 2 hour successfully crossed and is caught in limbo between the 21 and 77, this may or may not pull the 4 through as well if price can hold the line.
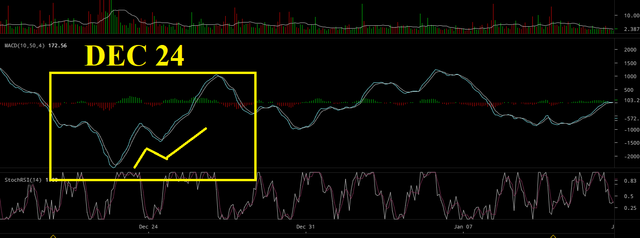
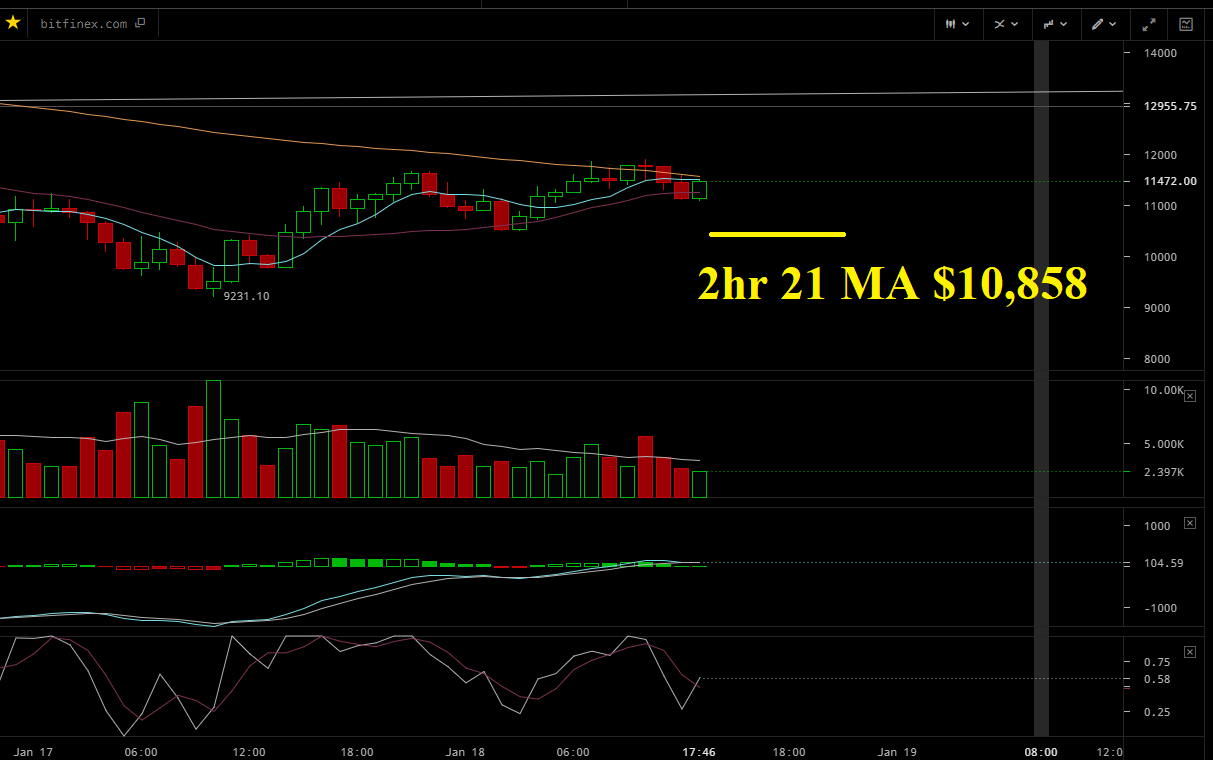
The 2 hour, my favorite frame in the grand scheme of things. Volume drying on sideways / to up price and overbought on the RSI showing uncertainty and cracks at this price level. We do have a 7/21 cross under the 77, but I already played that and it may be running out of gas. Price is trapped between the 21 and 77 while the 1 hour is struggling to break the 77. If the one fails, and gets rejected then the first stop in a flop is $10,900 or the 2hr 21 and from there we go enter potential free fall territory again. Most tellingly on this time frame is the MACD making a 60 degree northward turn. These usually do not work out and there is most often a pull back of sorts for momentum gathering to test the 0. I have highlighted the previous case of a similar MACD/Signal line high north turn and pull back.
Adding in the 1 hour to give understanding of what is occurring. Price is fighting hard to break above the 77. If it is successful expect a follow on buying period, increased volume and the 2 hour to begin its battle against its 77 MA. The 1 hr 77 will then act as support against downward price in much the same way as the 30 min is doing now. We are also close to a 7/77 upwards cross on the hour which will need a lot of volume and buyer support to make it happen. Price has ventured above the 77 and summarily been rejected 3 times so far. This attempt to solidly breach the 77 is the first and may likely get rejected. At current price seems content to ride just below the 77 as it looks for a lower price point for another attempted crossing. Many times it takes 2 or more solid rejections for lower prices before a 1 hour breach of the 77 by the 7 and 21 can occur. It’s a wait and see game at the moment if you did not buy into the earlier crosses or beginnings of buying periods as you may jump into a reversal and get capital raped.
My Previous Analysis:
https://steemit.com/bitcoin/@pawsdog/1-17-2017-the-market-view-and-trading-outlook
https://steemit.com/bitcoin/@pawsdog/1-16-2017-the-market-view-and-trading-outlook
https://steemit.com/bitcoin/@pawsdog/1-15-2017-the-market-view-and-trading-outlook
https://steemit.com/bitcoin/@pawsdog/1-14-2017-the-market-view-and-trading-outlook
https://steemit.com/bitcoin/@pawsdog/1-13-2017-the-market-view-and-trading-outlook
https://steemit.com/bitcoin/@pawsdog/1-12-2017-the-market-view-and-trading-outlook
https://steemit.com/bitcoin/@pawsdog/1-11-2017-the-market-view-and-trading-outlook
https://steemit.com/bitcoin/@pawsdog/1-10-2017-the-market-view-and-trading-outlook

Things are again very uncertain, like you said. In my opinion we will defitely re-test the 9-10 000$. Next stop i think will be 8000$, when I do my analysis I look very closely to the price action, just before the close. With 45 mins left, I think tomorrow will be a very interesting day, not to mention the weekend.
I agree sir and great minds think a like. There seems to be a lack of faith at the moment.. On a side note.. I found a good store of value Alt coin.. NBT it sits at around 1 USD no matter what BTC is doing.. There are 1,000,000 orders north and south to keep price stable. I have been hiding there on the BTC downs.. May not always work but seems to be doing ok for now... :)
I don't see NBT in Coinmarketcap. Also, why risk with this one, if you can use Tether ? But the important thing is that it works for you :)
I can't get polinex or bitfinex.. I have kraken, coinbase, gemini and bittrex.. so finding safe havens to weather out the storm are tough.. That one for over a month.. someone has been keeping at $1.00.. a $2,000,000 buy order 1 percent below a $2,000,000 sell order to control price. Not sure who is doing it but they want it at a dollar. I notice that when BTC dives another $1,000,000 will come in.. So I think it is someone with big $$$$ playing alts on Bittrex and holding NBT steady as there own personal piggy bank...
Lol, that would be crazy. P.S. Why can't you get on polo or bitfi. My vafourite is binance though.
Bitfi cut ties with US citizens. So you can't use it from the US...
I did this snapshot especially for you, pawsdog !
The 590BTC on the bid at 10,900. The same ones you were referring 2-3 days ago. I guess we all know what happens next, lol.
Theory is price goes up big in a big way.. also the 1000BTC buy in 1 minute at $10,900 at 0300 on Bitfinex...Just a theory, what are your thoughts...?
I think BTC will pair gains until market close and it's going down afterwards. P.S. I don't have something to back this up, it is just a speculation. 12 000$ is the new resistance I guess ? It's blurry for me, I am more interested in the eventual US Government shutdown.
US government shutdown? of BTC? They do have the power to do so...
https://steemit.com/bitcoin/@pawsdog/could-the-us-ban-bitcoin-trump-administration-considering-btc-regulation
no, no. There can't agree on the budget, it is for their budget. If they can't agree on their budget, they shutdown the governemnt, until a consensus is reached.
Tether or gamble? ;)
I know right..
I'm looking forward to March.
Whats in March?
Apparently predicted moon shots.
huh? That went over my head..
When a coin is going to take off big, it is going #ToTheMoon
I've seen a few people suggest that after this cyclic January correction, we should see movement in March, for spring.
I figured that was where you were going but I was not sure how abstract you were being or whether there was sarcasm.. :)...
There was sarcasm... and some hope.
Hope is a dangerous thing in crypto... :)