1/15/2017 The Market View and Trading Outlook
Another interesting day in the BTC market has passed and it looks as if we may have dodged yet another crash bullet; as the $13,000 again proved its strength by repelling the bears. That said I let my emotions intervene yesterday and I was decidedly more bearish than I probably should have been, but based on the timing of the articles release in the early A.M. there was not a ton of positive news to be had. Today is a different story as the shakeout from yesterday allowed time to pass and with it the 77 period moving average for the 2 hour dropped to a point that it was finally and decisively breached on higher than average volume.
This is a relatively big deal as it was the rejection of price at the 77 on the 2 hour that brought about the latest retest of the $13,000 or lower boundary of a potential bullish triangle. Sometimes I lose my objectivity due to a lack of patience. In watching the charts throughout the day yesterday I noticed a lot of very very large buys in the lower range and began to come to opinion that an accumulation was occurring and/or that price could be reflective of manipulation to further the goals of some very large whales.
I found it odd to see numerous 500 BTC buy orders and a few 1000 BTC buy orders acting as a bid wall against sellers around $13,300, $13,500 etc. In applying a common sense approach it occurred that if you are wealthy enough to purchase 7-14 million dollars worth of BTC at a time you probably know something the average retail investor does not or you are manipulating the price to further your own goals. I also noticed numerous suspicious large sell order that would push price back down into these bid walls where they would be gobbled up, price would stop and move back up.
In many instances you will see bid walls designed to manipulate price or they will be pulled before they can be filled as the person or institution behind them had no real intent of purchasing or selling that great an amount at the price of their bid. Instead their goal is to get others to think they do so that they will either buy ahead or sell ahead of them so as they can flip price the other way and make a killing. In the trading from yesterday I watched many of these huge buy order fill without being pulled. Ergo, someone or an institution or various whales are accumulating a large amount of coin in the lower range of a potential triangle. This is just a theory..
Moving to the charts.
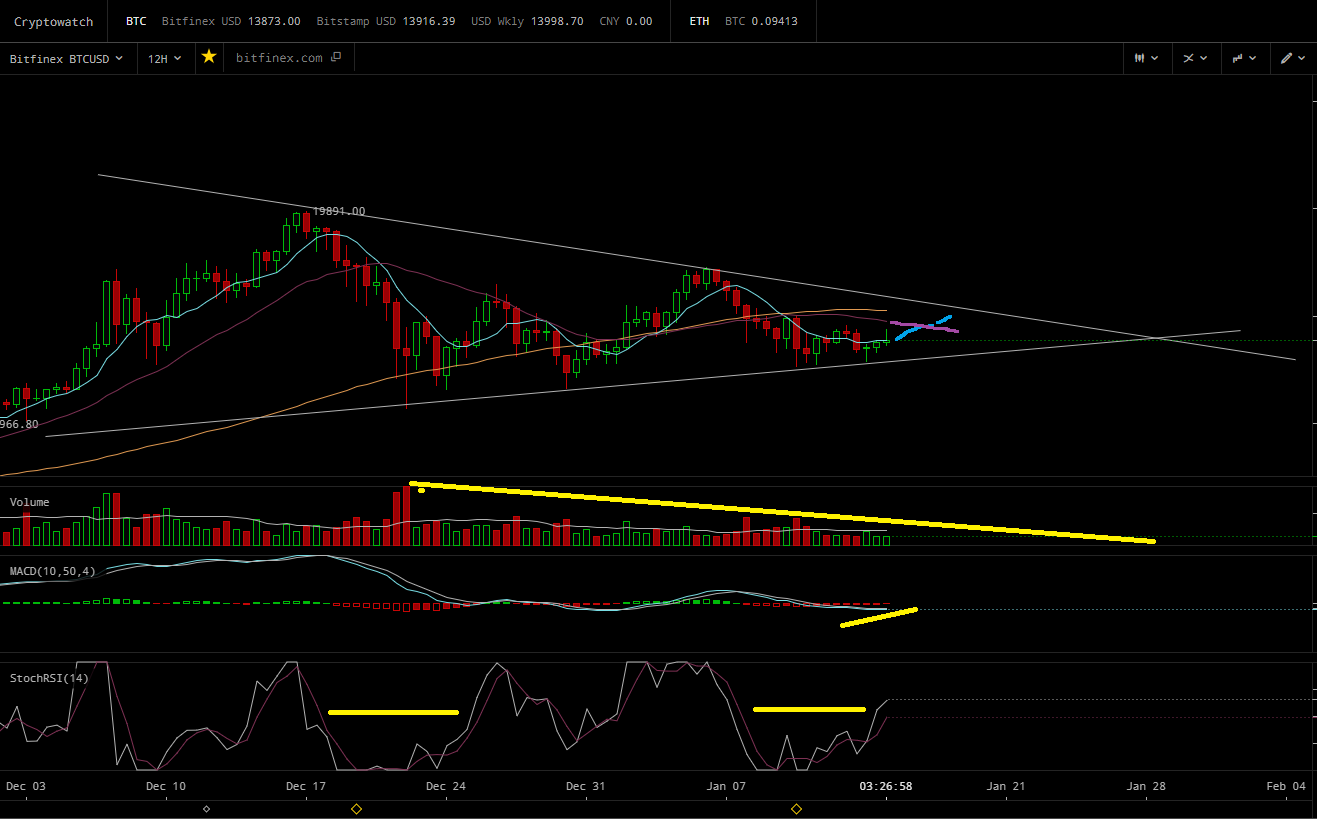
The 12 hour again shows a selling period that may rapidly be coming to an end, and according to the histogram the most resent retest of the $13,000 was a follow on and much less sever selling period than the one that preceded it which is a bullish indicator. Additionally we may be on the verge of a 7/21 upside cross below the 77 (it has not occurred yet and may not) the 7 may also bounce off the 21 at the upper boundary of the triangle and retest it again towards the intersection for a large breakout to the up or down.
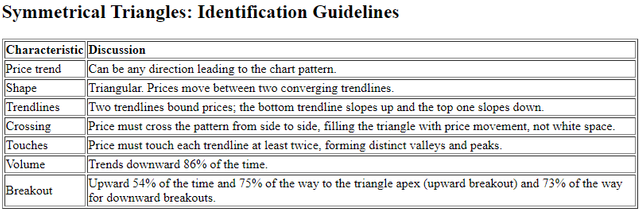
As the $13,000 or lower triangle boundary has consistently proved its resiliency, sellers are bound to tire at a point, and buyers should then take control. What we are seeing in regards to volume is a good sign as its getting lower and lower the closer we get to the apex. This is an indication of a bullish triangle and a very good potential indicator that a positive upswing "may" be in the cards. That said expect rejection at the upper boundary again and a tough battle for price at the $14,600 mark. If we can break and hold then the longer term future will look considerably brighter. Technically this is called a symmetrical triangle and would indicate a resumption of prior trend which was up. That said a further retest of the $13,000 may start to break it and price would likely move down the the longer term 77 on the 1 day at around $11,000 and lower from there. Its very hit or miss at the moment.. so be careful
I know @cheetah is going to get me, but for reader ease I’m just going to quote the next two paragraphs from here: https://www.investopedia.com/university/charts/charts5.asp.
Symmetrical triangle
”The symmetrical triangle is mainly considered to be a continuation pattern that signals a period of consolidation in a trend followed by a resumption of the prior trend. It is formed by the convergence of a descending resistance line and an ascending support line. The two trendlines in the formation of this triangle should have a similar slope converging at a point known as the apex. The price of the security will bounce between these trendlines, towards the apex, and typically breakout in the direction of the prior trend.”
”If preceded by a downward trend, the focus should be on a break below the ascending support line. If preceded by an upward trend, look for a break above the descending resistance line. However, this pattern doesn't always lead to a continuation of the previous trend. A break in the opposite direction of the prior trend should signal the formation of a new trend.”
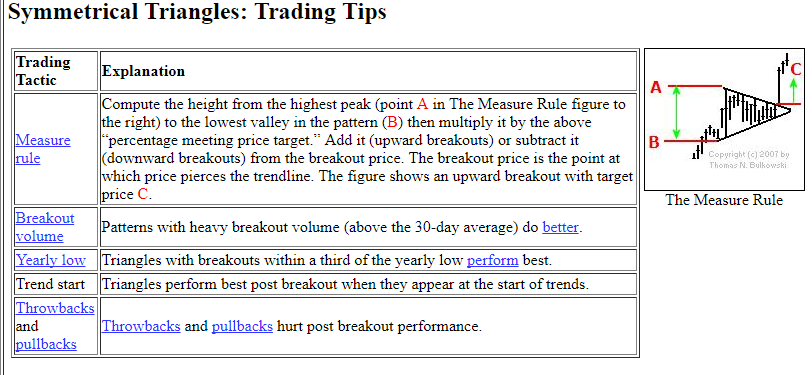
”Above is an example of a symmetrical triangle that is preceded by an upward trend. The first part of this pattern is the creation of a high in the upward trend, which is followed by a sell-off to a low. The price then moves to another high that is lower than the first high and again sells off to a low, which is higher than the previous low. At this point the trendlines can be drawn, which creates the apex. The price will continue to move between these lines until breakout.”
The pattern is complete when the price breaks out of the triangle - look for an increase in volume in the direction of the breakout. This pattern is also susceptible to a return to the previous support or resistance line that it just broke through, so make sure to watch for this level to hold if it does indeed break out. “
Source: https://www.investopedia.com/university/charts/charts5.asp.
Compare the current 12 hour with the example image and definition and then you decide. As for me, in looking at it more objectively based on its recent behavior, the resiliency shown by the lower boundary I am slowly re accumulating a bit to sell at the upper boundary. Do I have sufficient confirmation to make any big moves? Not yet, but no risk no reward and I have to put my feelings aside to be a bit more objective.
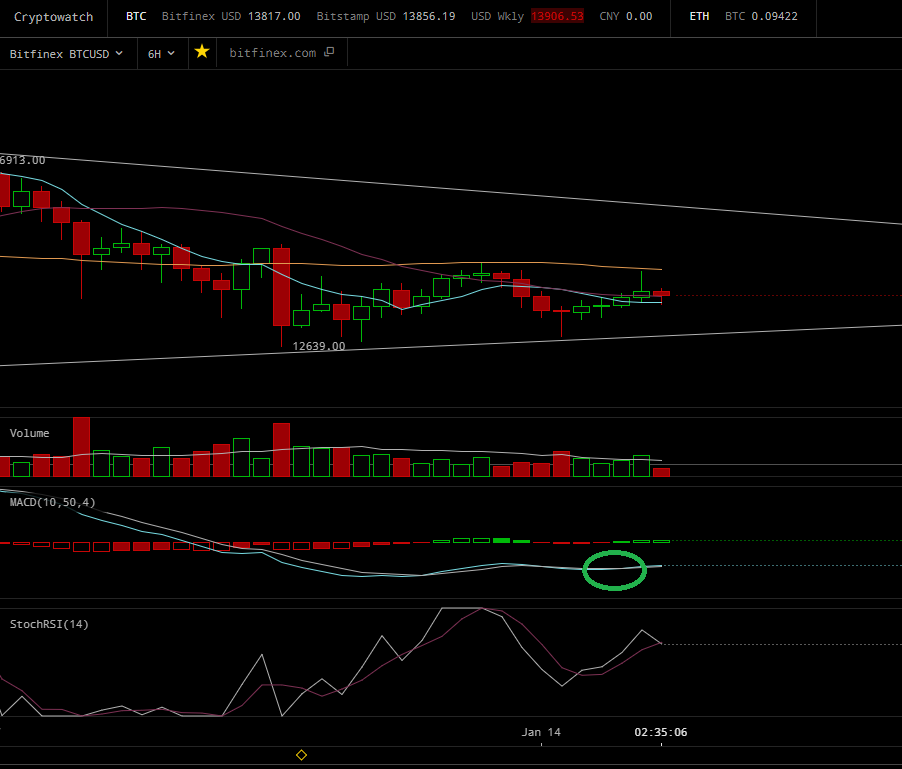
The 6 hour is not lovely but not bad, we do have an MACD/Signal line crossover which is bullish and we are in a buying period that is somewhat uneventful. If we are in a symmetrical triangle this could be expected as volume begins to dry up and price stagnates before making a large move. We are below MACD 0 so it will serve as upside resistance but in the event of a breakout it will have limited if any effect on price as momentum will slash through it to the upside. Regardless we are still running out of time for a move and will certainly know something very soon. Breakouts usually occur 75 percent of the way into the pattern and before price actually reaches the apex, so do not expect this to run all the way to the end.
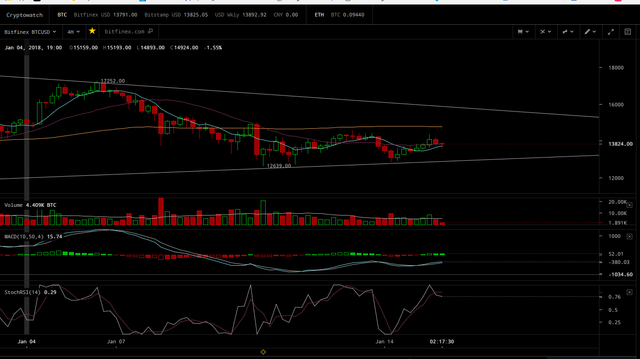
The story with the 4 hour is pretty much the same as the 6, price is narrowing, volume is dropping and a move one way or the other is likely to occur sooner than later. According to the statistics of the pattern 56% of the time it is up, 44% it goes down. With the narrowing MACD histogram on the 12 hour showing that we may be closing this follow on selling period a further retest of the $13,000 it is likely. If it holds then the overall next move would likely be to the upside as we may be sold out for the time being. If it fails things will go bad in a quick way..
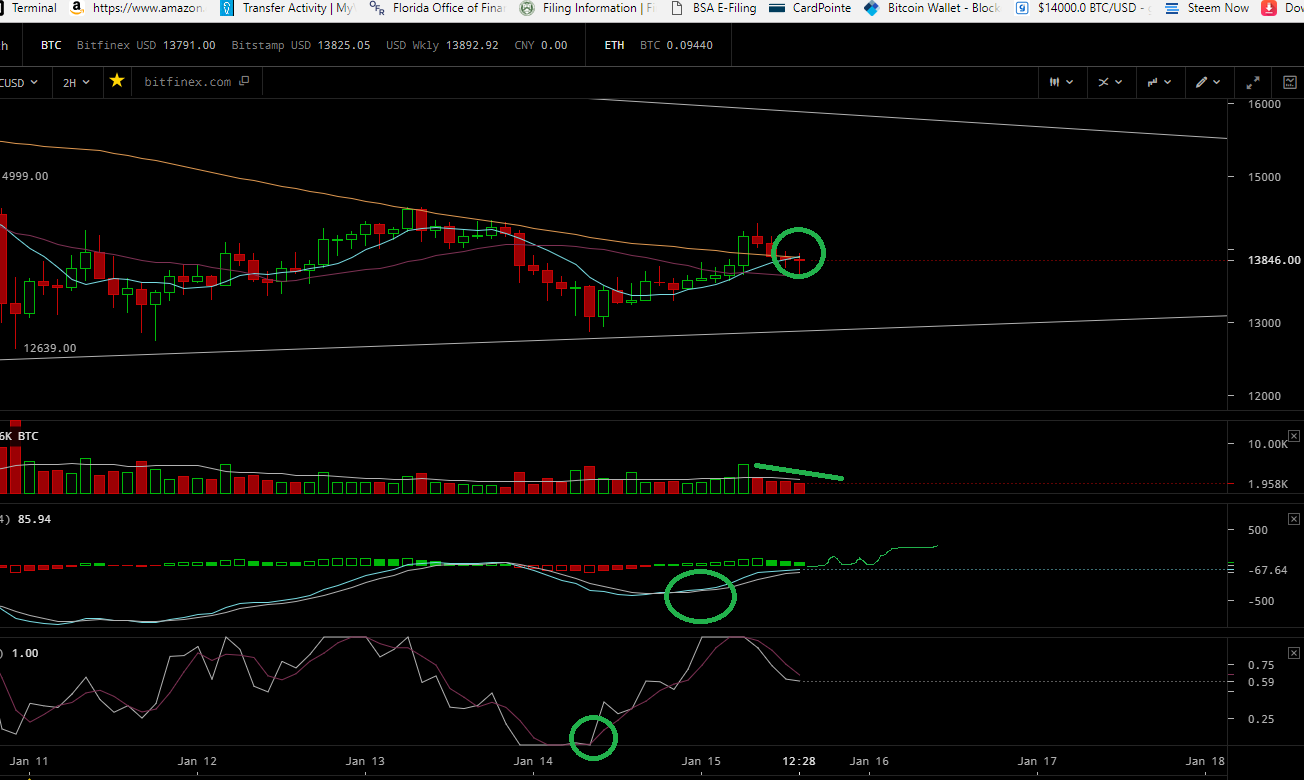
The 2 hour is providing me the most insight for the moment. We are very very close to a 7/77 upside cross or it may of already occurred; the lines are too close to tell for the moment. Also selling volume is decreasing at a steady rate, indicative that they are running out of gas and likely to jump on the bull train. The 2 hour is also defending the longer term 77 now that it has been able to cross over and above it. Preceding two hour buying volume also far exceeds the selling volume a sign that someone has much faith in where the price is headed. We do have an RSI positive cross, an MACD/Signal line cross and possibly a 7/77 upside cross; all bullish. We are below the MACD 0 so expect price to either dip more or go sideways prior to a big move. Based simply on this chart, and none else I may open a bit more towards the long side based on the 7/77 cross "if it occurs". If it does not, expect a quick drive southward on the moving average rejection.
Take everything with a grain of salt as this is crypto and this pattern does not always go to the upside. Do your own research make your own decisions and remain objective.
Stats on this potential pattern:
My Previous Analysis:
https://steemit.com/bitcoin/@pawsdog/1-14-2017-the-market-view-and-trading-outlook
https://steemit.com/bitcoin/@pawsdog/1-13-2017-the-market-view-and-trading-outlook
https://steemit.com/bitcoin/@pawsdog/1-12-2017-the-market-view-and-trading-outlook
https://steemit.com/bitcoin/@pawsdog/1-11-2017-the-market-view-and-trading-outlook
https://steemit.com/bitcoin/@pawsdog/1-10-2017-the-market-view-and-trading-outlook
https://steemit.com/bitcoin/@pawsdog/1-9-2017-the-market-view-and-trading-outlook
https://steemit.com/bitcoin/@pawsdog/1-8-2017-the-market-view-and-trading-outlook
https://steemit.com/bitcoin/@pawsdog/1-5-2017-the-market-view-and-trading-outlook
https://steemit.com/bitcoin/@pawsdog/1-4-2017-the-market-view-and-trading-outlook
https://steemit.com/bitcoin/@pawsdog/1-3-2017-the-market-view-and-trading-outlook
https://steemit.com/bitcoin/@pawsdog/1-2-2017-the-market-view-and-trading-outlook

Those big buy orders are likely institutions picking up what, for them, are relatively small pieces of BTC. Sell walls are probably early adopters looking to buy a beach house.
As you point out, it’s basically a coin toss, but the bullish above, bearish below, line is clear enough, so at least we know where to put stops. The question is whether everyone else is also putting their stops at the same level and what waterfall effect could develop if triggered.
It also pays to keep in mind where this is happening in the larger context. 😉
Very very true.. I would imagine the $12,000 -$12,400 level would see some major stops opening up and a waterfall of interesting proportions. It hit or miss at the moment, with just a few percentage points inclining it to the upside.. also if you do go south, there are going to be a ton of disgruntled buyers that will be tired and sell off fast and in a big way.. This correction has been pretty brutal for some.. so it it will be interesting to see which way it goes. Looks like we get to test is again, and with each test it weakens.. very interesting..
More likely the second one, manipulation with "only" 7-14 Mill is sweet for the wall street boys.
This sideways action is pretty difficult to play. At the moment I am more like waiting for the sideways to end. My analysis shows that a bullish and a bearish case can be built from the charts, also things are about to get political pretty soon.
You might be interested in this piece of info
As always, thank you for the fantastic job !
Thanks, yes that will have a huge impact on what occurs.. I did upvote and resteem your article.. It's such a coin toss at the moment and I'm not putting a ton of faith either way at the moment
Totally, Patience is a traders best friend. I am also waiting for the right moment to make a move.
I am very glad that you liked my article :) It means a lot to me - thanks !
Same here, same here.. I caught at the bottom support line yesterday so i'm waiting to see what occurs...either way she is running out of both room and time to do something interesting..
Yes ! We will wait and prepare for the opportunity.
Do you think the Facebook stock drop will have/has had any effect on BTC?
I am not sure, I have not checked it and was unaware FB dropped.. but checking it now.. I doubt they had any correlation to each other..
And so the break looks to be down... interesting..
the market is good, thanks sharing, i vote for u
Thank you..
Beep! Beep! This humvee will be patrolling by and assisting new veterans, retirees, and military members here on Steem. @shadow3scalpel will help by upvoting posts from a list of members maintained by @chairborne and responding to any questions replied to this comment.