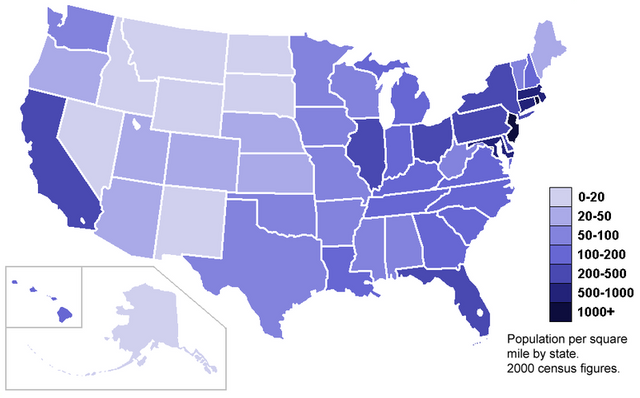
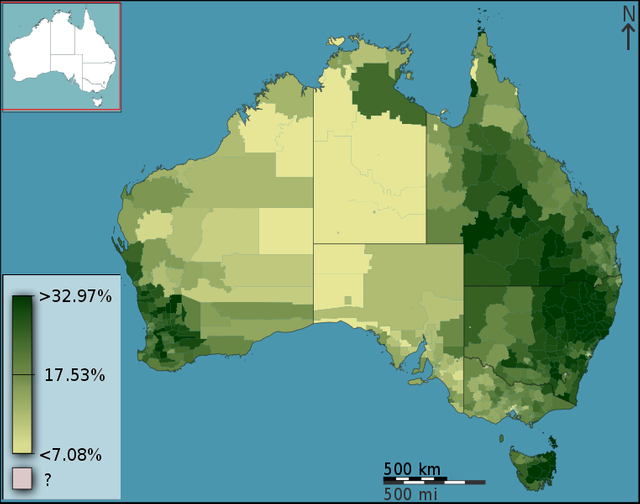
INTRODUCTION TO CARTOGRAPHY - ELEMENTS OF CHOROPLETH MAPPING
How are you doing people? I hope everyone's having a wonderful day. The weather is still fine over here, giving us the opportunity to visit the beach and spend a couple relaxing hours. However, I am always very busy and that is the main reason why I did not get back to blogging for more than five days. Thankfully that's not the case any longer, as I found some free time and decided to add another part to this series. I am always in a rush though, so let's waste no more time. Let's do this!
As promised in a previous Cartography post regarding Chloropleth mapping, we are now ready to proceed to the next category of Thematic maps, having already discussed the basic elements of isarithmic and choropleth mapping. This time we are going to take a deeper look at the fundamental elements of choropleth mapping that were mentioned in the previous part of this series. We will talk about the size and shape of the surface units utilized and share general information regarding the number of classes used and how it affects the process of choropleth mapping. We will also talk about the methods followed in order to define the range of each class, so stay focused.
As always, here comes the part where I include a personal note for all of you who are new to this blog; this is simply an introductory series about Cartography, which is the art and science of extracting metric information in order to create accurate 2D depictions of our 3D world. This means that I will be sharing broad information in a simplified manner, so that nobody gets too bored reading this post! There's always a high chance of learning a thing or two by reading till the end of this publication, so stay tuned!
Symbolization Problems
As explained in the previous parts of this series, Choropleth maps are desgined and constructed by taking into consideration the structure of the data being gathered. That said, it is more than obvious that the shape, size and orientation of the units utilized affect the quality of our end product. The Choropleth process relies on the creation and utilization of homogenous surface units with huge variations between the boundaries of successive units. That is the main reason why Cartographers need to approach this matter with caution, as the structure of the data gathered might induce systematic errors in cases where it fails to represent the underlying geographic distribution.
There are three categories of errors that are usually generated by the fundamental elements of Choropleth mapping. The number of classes used and the proper selection of class ranges are the main factors of the ones generating systematic errors in Choropleth maps that have been thoroughly studied, to the extent that Cartographes often use error indices in Choropleth map memo boards regarding those types of errors in particular. The magnitude of errors affects the symbolization process and gives birth to more obstacles, as one can't accurately depict a geographic distribution with parameters that are not precisely known.
This is the main reason why there are three main categories of errors, depending on the map's purpose and the information it was designed to contain. Some Choropleth maps are built in order to represent the exact geographic location of the distribution units, whereas there are cases in which Choropleth maps were designed to provide a general view of the geographic distribution utilized. Moreover, some Choropleth maps were designed in order to precisely depict the boundaries between classes, which are projected as straight lines. Let's take a look at the fundamental elements of Choropleth mapping.
Shape & Size of Surface Units
The surface units of an area of interest can be perceived as parts of a pattern that represents a generalized view of the area. If the size of the surface units utilized exceeds standard limits then there's a high possibility that the spatial variation of the data being used tends to be homogenous, while in cases where the surface units are smaller than usual the variation of the end product is much larger. Different magnitude of variation between different areas of the map is often caused by the utilization of surface units that differ in size, resulting in an unequal map generalization which is never a desirable result. The Choropleth process induces the need for the selection of units with the same size and similar shapes; that is the most efficient way to get the best possible end product.
Number of Classes
The most commonly used versions of the Choropleth process gives birth to end products that include symbols of a graded range. The number of classes used plays a rather significant role as it defines the level of detail of the geographic distribution being mapped, which basically means that Cartographers choose to include as many classes as possible. The only limitations placed are by the finite dimensions of the map surface, in other words Cartographers will always choose to include as much information as possible, as long as the map remains clear and readable. It is worth noting at this point that the maximum number of classes that can be included depends on multiple factors, one of the most significant of which is the complexity of the geographic distribution.
Another significant factor is the utilization of color. In maps where no color is used it is a lot harder to include vast amounts of information and therefore Cartographers can only use a smaller number of classes. That is mainly due to the way the human sensory system works, as explained all over again in the previous parts of this series. It is worth noting at this point that Cartographers often used patterns or even intensity as a primary visual variable in order to depict different classes in greyscale maps, however it has been proven that users cannot observe more than eight different classes in Choropleth maps built without the utilization of color. Nature.
Class Range
Defining the values that represent the boundaries between classes with accuracy is one of the most studied and discussed topic in Cartography in general and there are tons of information regarding the methods that are most commonly followed. Those values are calculated by the time that safe conclusions regarding the number of classes that will be used have been reached. The same methods that are used to define the class ranges are the ones followed in the creation of graded point and linear symbols, which by the way was the point of discussion of a previous post. Nowadays' scientific development and available technology has enabled Cartographers to develop more ways of defining the values that represent the boundaries between classes.
Choosing class ranges can be a rather confusing task as Cartogtraphers have to make sure that the crucial values of a distribution are depicted with accuracy. The availability of multiple different methods makes it relatively easier for Cartographers to choose and use patterns that would result in a visual outcome that would not represent the data being used appropriately. In other words, it is easier to make significant mistakes that would in return downgrade the end product's quality. This works the other way round as well, meaning that the utilization of the appropriate class range and boundaries would definitely result in a much better view of the geographic distribution.

Alright everyone, that's it for now. Thanks for being here, another part of my Introduction to Cartography series has come to an end. There's still a long way to go, so make sure to follow me and stay tuned. If you do have any questions regarding this blog, please let me know in the comments below and I will do my best to provide prompt and detailed answers. More Engineering stuff regarding Cartography and Geology coming out within the next days, so stay tuned and follow me for more!
PREVIOUS PARTS OF THE SERIES:
IMAGE SOURCES:
REFERENCES:
University Textbooks & Course Lectures:
- Χαρτογραφία Ι/ Cartography I -TSOULOS(National Technical University of Athens, School of Rural & Surveying Engineering, Course Lecture Notes)
Internet Links:
https://prism.ucalgary.ca/bitstream/handle/1880/45758/2001-693-16.pdf?sequence=2&isAllowed=y
https://gisgeography.com/choropleth-maps-data-classification/


I will be featuring it in my weekly #technology and #science curation post for the @minnowsupport project and the Tech & Science Guild! The Tech Bloggers' Guild is a new group of Steem bloggers and content creators looking to improve the overall quality of our niche.
Wish not to be featured in the curation post this Friday? Please let me know. In the meantime, keep up the hard work, and I hope to see you at the Tech Bloggers' Guild!
If you have a free witness vote and like what I am doing for the Steem blockchain it would be an honor to have your vote for my witness server. Either click this SteemConnect link or head over to steemit.com/~witnesses and enter my username it the box at the bottom.
Thank you so much for taking the time to read my work and especially for your kind words and support! Of course I would love to be featured in the curation post, thanks again!
Have a good day!
Έχεις τον τρόπο να μας εντυπωσιάζεις!!!! :))))))
Γεια σου ρε Νικ αρχηγείο!
Congratulations! Your post has been selected as a daily Steemit truffle! It is listed on rank 12 of all contributions awarded today. You can find the TOP DAILY TRUFFLE PICKS HERE.
I upvoted your contribution because to my mind your post is at least 9 SBD worth and should receive 131 votes. It's now up to the lovely Steemit community to make this come true.
I am
TrufflePig, an Artificial Intelligence Bot that helps minnows and content curators using Machine Learning. If you are curious how I select content, you can find an explanation here!Have a nice day and sincerely yours,

TrufflePigWhat a lovely bot you are!
You are always welcome to join us and get more recognition for your posts. You can find more information about geopolis here or join our Discord server.
Thank you for the constant support!
Hi @lordneroo!
Your post was upvoted by @steem-ua, new Steem dApp, using UserAuthority for algorithmic post curation!
Your UA account score is currently 3.818 which ranks you at #4390 across all Steem accounts.
Your rank has improved 79 places in the last three days (old rank 4469).
In our last Algorithmic Curation Round, consisting of 597 contributions, your post is ranked at #110.
Evaluation of your UA score:
Feel free to join our @steem-ua Discord server