INTRODUCTION TO CARTOGRAPHY - ELEMENTS OF ISARITHMIC MAPPING
How are you doing today? Hope you enjoyed your summer to the fullest. A new (academic) year is about to begin; a year that looks promising and will bring many challenges. I like to call them chances. Chances to grow, learn and evolve. Everything is fine as far as I am concerned, however I am quite busy and as a result I haven't shared the next part of this series with you even though it's been twenty days since my last Cartography blog. But I am back to make it up to you, so I don't mean to waste your time. Let's do this!
As promised in a previous Cartography post regarding isarithmic mapping, this is the twenty-first episode of this Introduction to Cartography series. This time I am taking the chance to share general technical information about the fundamental elements of the isarithmic process. After making an introduction (see what I did there?) regarding isarithmic mapping in my previous post and sharing broad information concerning the two cases in which the isarithmic process is utilized, I believe readers are now ready to learn the details of this process. We will talk about control points and the element of interpolation. Bare with me as this is going to be an exciting part for science lovers.
As always, here comes a personal note for those of you who are new to my blog; this is just an introductory series about Cartography, which is the scientific field of gathering measurements and creating accurate 2D depictions of our 3D world. This basically means that I will be presenting general information with a pinch of humour, as I believe it is always easier to learn while having fun. There's a high chance of learning a thing or two by reading through this series' episodes, so stay tuned!
Symbolization Problems
As explained all over again in the previous Cartography blogs of mine that are directly related to the map symbolization process, when it comes to designing the proper symbols by taking into consideration the spatial elements that are being measured and represented and the visual variables that will be utilized, we are talking about a rather complicated job that demands theoretical knowledge and experience. It's actually even more complicated than my previous sentence. It's worth mentioning that one of the main factors that add layers of difficulty is the fact that this process induces the need for theoretical knowledge that is related to various scientific fields. The design of the statistical surface for an area of given dimensions can be a nightmare and demands the utilization of all sorts of spatial data.
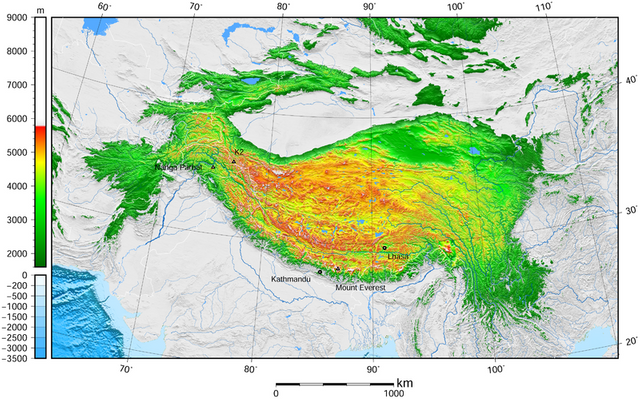
In this blog we are going to discuss problems that refer to all measurements and calculations necessary for the accurate design and construction of the statistical surface under specific conditions. The existence of volumetric data on a surface of given dimensions has to be represented with the utilization of only point and linear symbols, which are the main components of most isarithmic elements that are broadly used even to this day. The most commonly used elements are isarithmic lines, which are obviously comprised of linear symbols and in reality represent a trace of the intersection between a horizontal plane with a statistical surface. These lines are orthogonally projected on the map's reference surface and depict statistical distributions of values that refer to point data.
However there are also cases of isarithmic lines that do not refer to spatial characteristics of point data and therefore do not depict statistical distributions of values concerning geographic phenomena that are linked to specific points in space. It is a commonly accepted rule that when building an isarithmic map we are actually dealing with three key elements of the isarithmic process; the location of our control points, the interpolation process followed for the estimation of values in areas between control points, and the number of control points. Let's take a deeper look at each one of those elements and share some broad information regarding the significance of each.
Control Points - Location
A mathematical entity composed of three numerical values (x,y,z) is also known as a Control Point. These numbers of course are not random; the values x and y refer to the location of a specific point on the statistical surface, whereas the value z refers to the spatial characteristic that is being studied, measured and represented. The location (x,y) of all control points is always predefined in cases where the statistical surface that is being mapped refers to values of characteristics that are related to specific points in space. The definition of the 2D location of control points is a lot harder when creating maps based on distributions that refer to percentages or any kind of ratio, and this happens mainly due to the fact that such measurable quantities are linked to surface units.
As a result, Cartographers often have to set predefined locations for all control points without having to conduct any sort of research or calculations. This in return enables Cartographers to place isarithmic lines which serve as tools that will help later on with the accurate placement of control points, which basically means that a pair of more appropriate (x,y) values will replace the previous ones for all control points. In cases where the distribution of spatial elements is uniformal on a surface of normal shape and given dimensions, Cartographers are allowed to place control points in the center of that surface, whereas in cases where the distribution of spatial elements is not uniformal the control point used is usually placed in the center of the area with the highest concentration.
Interpolation
This is another rather significant isarithmic element. The interpolation process is a method which is followed in order to enable Cartographers and Engineers in general to come up with precise estimations regarding the values of spatial characteristics for points situated in areas between the control points being used. The term interpolation in mathematics describes an attempt to calculate values for points in space situated between at least two reference points of known coordinates (remember, the value z might refer to characteristics and therefore might not have anything to do with a point's 2D location). It is worth noting and keeping in mind that this technique can only be applied in cases where it is assumed that any variation regarding the values of spatial characteristics happens in a linear manner. That is a basic assumption without the validity of which our estimations cannot be credible.
The calculation of the mean value of any values estimated with the utilization of the interpolation process is necessary and is the quantity that is taken into consideration in cases where the availability of observations and measurements is not satisfactory. This method is mostly followed in cases where Engineers need to design contours regarding altitude with the utilization of computer software. Virtual environments enable Cartographers to follow non-linear methods as well, which ironically is a factor that induces confusion and perplexity as it provides the user with a wide range of options, making it almost impossible to decide which strategy would be the most effective one. The cons of progress! See what I did there?
Control Points - Number
This is the final isarithmic element, however it might be the most significant tool of isarithmic mapping. Cartographers have to gather observations and measurements in order to come up with values regarding the spatial characteristics that are going to be mapped and represented. The alternative option is to pick measurements from a predefined set of numerical values, without being able to increase the number of the available observations (and therefore calculations) or to upgrade the measurements' precision. Cartographers that gather the values of characteristics are capable of affecting and manipulating all three isarithmic elements mentioned so far, something that is not the case when they are just provided with a predefined set of numerical values.
It is commonly accepted that the number of control points affects the quality of the depiction of our isarithmic surface. The larger that number is, the easier it is to provide quality depictions that pay attention to detail. However, it is worth keeping in mind that even though all three components of the isarithmic process affect each other dynamically, increasing the number of control points is not always a good idea that comes with benefits. There is a point of no return, below which the quality of our surface's depiction cannot be optimized at all. It is safe to say that sometimes adding more control points leads to unwanted map generalization. Thanks for reading!
Alright science lovers, that's all for now. We have officially reached the end of this twenty-first part of my beloved Introduction to Cartography series. There's still a long way to go, we have a lot to discuss. Please bare with me and follow me for more, as there is a lot more to learn as we move forward. If you do have any questions, please do make sure to let me know in the comments below. More Engineering stuff regarding Cartography and Geology coming out within the next days, so stay tuned and follow me for more!
PREVIOUS PARTS OF THE SERIES:
IMAGE SOURCES:
REFERENCES:
University Textbooks & Course Lectures:
Χαρτογραφία Ι/ Cartography I -TSOULOS(National Technical University of Athens, School of Rural & Surveying Engineering, Course Lecture Notes)
Χαρτογραφία ΙΙ/ Cartography II - NAKOS(National Technical University of Athens, School of Rural & Surveying Engineering, Course Lecture Notes)
Internet Links:
http://www.geog.ucsb.edu/~kclarke/Geography183/Lecture11.pdf
https://prism.ucalgary.ca/bitstream/handle/1880/45758/2001-693-16.pdf?sequence=2&isAllowed=y


This post has been voted on by the steemstem curation team and voting trail.
There is more to SteemSTEM than just writing posts, check here for some more tips on being a community member. You can also join our discord here to get to know the rest of the community!
Thank you to the most amazing scientific community on the Steem Blockchain!
Happy 21st!
It's quite a tall number, hadn't realized there were so many in this series.
So what's next? Cartography 201? :D
Hey mate, glad to see you here! Hope everything is fine and looking forward to reading your next blog.
201 is not that much of a big deal, I intend to keep blogging about Cartography forever! :P
Have a good day!
Hi @lordneroo!
Your post was upvoted by @steem-ua, new Steem dApp, using UserAuthority for algorithmic post curation! Your UA account score is currently 3.789 which ranks you at #4454 across all Steem accounts.
Your rank has risen 76 places in the last three days (Your UA has improved by 0.000).
In our last Algorithmic Curation Round, consisting of 204 contributions, your post is ranked at #112.
Evaluation of your UA score:
Feel free to join our @steem-ua Discord server
Thanks for your support and valuable feedback!
Hi @lordneroo!
Your post was upvoted by utopian.io in cooperation with steemstem - supporting knowledge, innovation and technological advancement on the Steem Blockchain.
Contribute to Open Source with utopian.io
Learn how to contribute on our website and join the new open source economy.
Want to chat? Join the Utopian Community on Discord https://discord.gg/h52nFrV
Thank you, Utopian! I appreciate your support so much!
Καλημέρα Δημήτρη.... εντυπωσιακό!!!! :))))
καλό ΣΚ να εχεις...
Thank you Nick, να έχεις κι εσύ ένα τέλειο ΣΚ! Καλή συνέχεια!
Didnt know symbolization is this much important in cartography. I thought u could symbolize anything with what u like, lol.
Btw another great addition to this amazing series, bro!
Thanks for the kind words mate! I'm glad you came by and left a kind comment! Have a great day!
Have a good day too, bro.
Congratulations! This post has been upvoted from the communal account, @minnowsupport, by lordneroo from the Minnow Support Project. It's a witness project run by aggroed, ausbitbank, teamsteem, someguy123, neoxian, followbtcnews, and netuoso. The goal is to help Steemit grow by supporting Minnows. Please find us at the Peace, Abundance, and Liberty Network (PALnet) Discord Channel. It's a completely public and open space to all members of the Steemit community who voluntarily choose to be there.
If you would like to delegate to the Minnow Support Project you can do so by clicking on the following links: 50SP, 100SP, 250SP, 500SP, 1000SP, 5000SP.
Be sure to leave at least 50SP undelegated on your account.
Looks and smells like an inside job!
😄