INTRODUCTION TO CARTOGRAPHY - CLASSIFICATION & BROAD CATEGORIES
Hey everyone!
What's been up? Hope you had a wonderful time during the week. We're currently into the weekend so I suppose most of you are relaxing and probably having fun. So here I am to ruin everything with another scientific blog! Damn dude, leave us alone. I know I'm pretty predictable but I will have to say it was a rather exhausting week. It took its toll on me so I had to take some time off. Let's say I'm tired of being tired of being tired. However I'm back in business with another Cartography blog, so let's get going! I'm in a hurry again.
As promised in my previous introductory post about Cartography, this is my second post regarding the scietific field of creating 2D depictions of our 3D world with precision and extracting spatial and geographic information. This time I'm taking the chance to share technical information regarding the different kinds of classifications used to describe and categorize maps. I will also share general introductory information regarding broad categories of mappings that are commonly used, so stay focused
As mentioned, these are still introductory posts so I will try to keep things fun in order to prevent you from muting me. Jokes on you. What does that mean? That basically means that I will present some general information and try to approach business in a humoristic manner. I certainly believe that there's a high chance of learning a thing or two by reading this post, so stay with me!
Image Source: pixabay.com
Due to the fact that the number of combinations between a map's scale, objective and purpose is significantly large, there's a wide range of different sorts of mappings nowadays. The utilization of known classifications regarding mappings' purpose and objective as well as the use of maps for the extraction of various kinds of information enables Engineers to categorize mappings and therefore reach more accurate conclusions. One of the main problems that Engineers have to face at this point is the chasm between the information included and demonstrated on a map and the information received and perceived by the observer or reader. Maps have various functions and shapes and each one of the observers sees a different version of reality anyway. That said, it is pretty obvious that the interpretation of a map by random users cannot be predicted, unlike the Cartographer's intentions which are clearly demonstrated and stated through the use of symbols and scale. In order to elaborate on this we will discuss the similarities and differences between different kinds of maps by classifying those based on three different characteristics: (1) scale, (2) function and (3) content.
Classification Based on Map Scale
A Cartographer's main objective is to reduce the real dimensions of the geographic entities that are depicted in order to include large amounts of information. The ratio of the dimensions measured on a map to the dimensions measured in the real world is also known as map scale. The map scale is a rather useful tool utilized by Engineers and a significant factor that has to be taken into consideration when designing a map, mainly because it determines how much information can be contained and demonstrated efficiently. Maps that depict large surfaces of the Earth such as global maps are considered small scale maps, whereas maps that are designed to represent smaller areas of the Earth's surface such as cities or villages are referred to as large scale maps. Pretty confusing, isn't it? It all makes sense though if I tell you that this is totally irrelevant to the level of reduction applied; in fact the terms 'small' and 'large' actually refer to the depicted shape of the geographic entities included in a map.
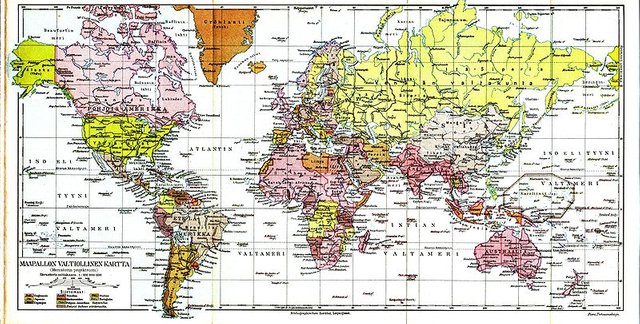
Image Source: commons.wikimedia.org
Obviously, when the level of reduction applied is comparatively small and geographic entities like roads are depicted in large shapes, then we are dealing with a large scale map. Therefore in cases when the level of reduction applied is significant and small geographic entities are barely visible, it is safe to say that it is a small scale map we're talking about. In such cases specific sorts of geographic entities have to be enlarged and magnified in order to be visible and demonstrate necessary information. The utilization of different categories of symbols make life easier for Cartographers, providing with the ability to depict little but significant details of the 3D world in cases of small scale maps. To summarize, Engineers try to depict reality very selectively and in a rather simpified manner in small scale maps otherwise it would be practically impossible to precisely construct such maps in the first place due to the excessive amounts of information observed, included and utilized in order to describe the Natural Terrestrial Surface.
In conclusion, the main emphasis of the design and construction of small scale maps is to provide simplified spatial information, however simplification still remains a significant characteristic of large scale maps as well. The fundamental difference is that in this case, large scale maps provide Engineers with the ability to depict multiple versions of reality with the appropriate analogy related to the level of reduction utilized. There's no official arrangement as to which are the specific boundaries separating small scales from large ones, mainly due to the fact that there's no valid reason whatsoever for Engineers to set such values. Nevertheless, most Cartographers would agree that maps with a reduction ratio of 1 : 50 000 or less (for instance 1 : 40 000) definitely belong in the broader category of large scale maps. Likewise, maps with a reduction ratio of 1 : 500 000 or more (for instance 1 : 800 000) are commonly considered to belong in the category of small scale maps.
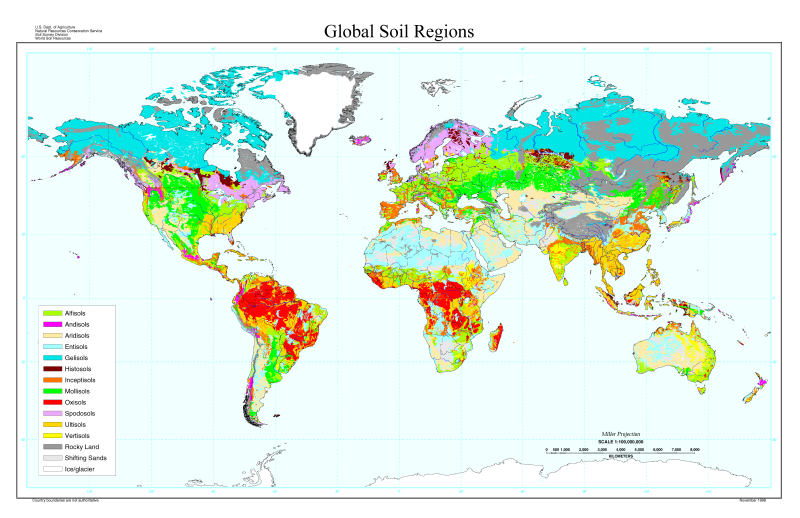
Image Source: commons.wikimedia.org
Classification Based on Map Function
As explained above, the exact boundaries that define magnitude of scale regarding mappings are not specific nor given. As a result there is a wide range of categories, the fundamental differences of which are not easily distinguishable. Likewise, every time Engineers try to classify maps in broader categories according to the purpose they were designed to serve, they stumble upon the exact same problem; there's a huge dispersion between the outliers and a large variability that makes the transition from one category to another a bit more systematic. However, the creation of broad categories was inevitable as it would make things easier regarding the extraction of precise data and the most efficient supervision of workload. Nowadays there are three main categories: (1) General Reference Maps, (2) Thematic Maps and (3) Navigation Charts. Now let's discuss some general information regarding those three main categories. Why not?
- General Reference Maps
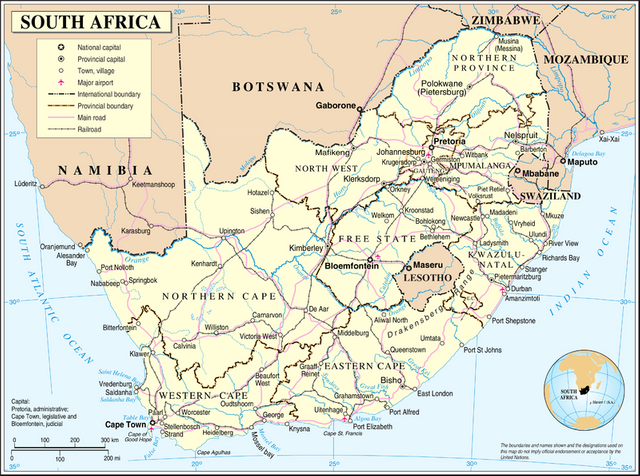
General Reference Maps serve the purpose of demonstrating the exact and precise location of multiple geographic entities. This category's objective is to provide accurate geographic information. Large scale General Reference Maps that depict areas of the land's surface are also known as topographic maps and are usually built by Public Services with the utilization of photogrammetric methods and are published independently. I will soon create an introductory series regarding Photogrammetry. :) Maps of much larger scales are necessary for the accurate localization of land plots and the precise calculaton of distances along with various similar technical reasons. Therefore there's a high demand for accuracy regarding relative positions between various entities that are being depicted. In many cases, such maps have the validity of legal documents and processes like the determination of borders and the calculation of taxes are based on the precision of those depictions. It is worth noting at this point that the standards of precision regarding mappings refer to the depiction's characteristics regarding distances and alitudes. This basically means that non measurable factors like errors in names are totally irrelevant to General Reference Map's construction accuracy.
General Reference Map./ Image Source: en.m.wikipedia.org
- Thematic Maps
Thematic Maps are also known as maps of specific objective and serve the purpose of precisely domonstrating the distribution of a phenomenon in space as well as the correlation of various phenomena. There's a wide range of Thematic Maps from satellite images regarding vegetation to electoral maps etc, temperature maps, maps of rainfall height, maps of population increase etc. However we should always keep in mind that Thematic Maps do not serve the purpose of providing accurate information regarding geographic position and therefore there might even be cases of maps that were designed to demonstrate the correlations between different classes of the same phenomenon but cannot be considered as Thematic Maps by definition. On the contrary there are maps the depict the exact same data with the slight but important difference of focusing on the accuracy of structure of the spatial distribution and thus are definitely considered as Thematic Maps. In the past decades Thematic Maps were mostly small scale maps due to the low volume of data available , however with nowadays' technological development Engineers possess larger volumes of information and as a result larger scale Thematic Maps emerge. Inevitably, as the map scale is getting larger the demand for precision regarding geography is higher, a factor that complicates things further as it represents a combination of different variables.
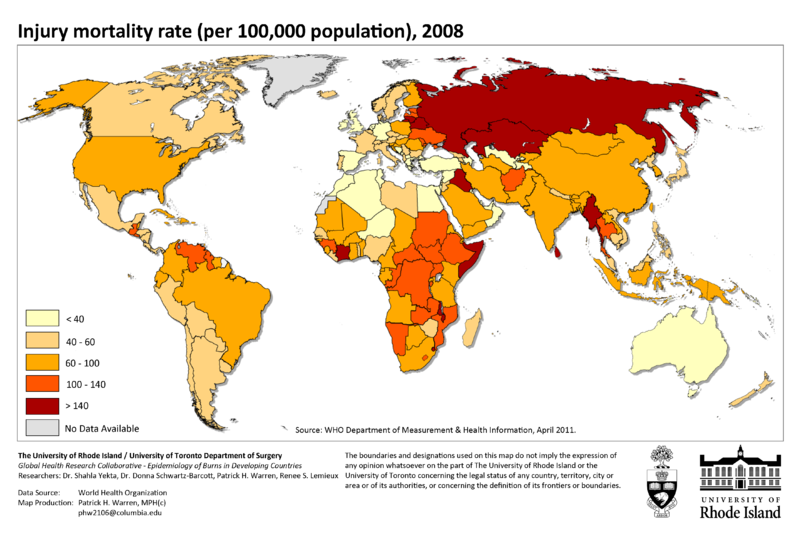
Thematic Map./ Image Source: commons.wikimedia.org
- Navigation Charts
Navigation Charts are maps that are specifically designed for navigation purposes. A simplified fundamental difference between regular maps and Navigation Charts is the fact that maps were designed to be observed, whereas Navigation Charts were designed for professional uses. Users of Navigation Charts draw various sorts of geometric shapes on the mappings in order to calculate steering angles and distances with precision. It's worth noting at this point that General Reference Maps such as bathymetric maps are often also used in navigation. Nautical mappings include sailing maps and general maps for visual navigation purposes or even for navigation through the utilization of radar technology in areas close to the coastline. Nautical mappings also include the categories of port maps and boat maps, categories that both emphasize on bythometric information, coastline definition and localization of lighthouses and sea markers. Regarding aeronautical maps, there are two basic types which emphasize on the visualization of flight and the navigation through the utilization of digital instruments respectively. Aeronautical maps for flight visualization purposes include information regarding the location of cities, road networks, railways and airports, whereas aeronautical maps for navigation purposes include mappings of flight radiofrequencies, mappings of airports and mappings of landing routes. It is worth mentioning at this point that only a few maps are genuineThematic Maps or General Reference Maps as most depictions combine the various main functions of those two categories.
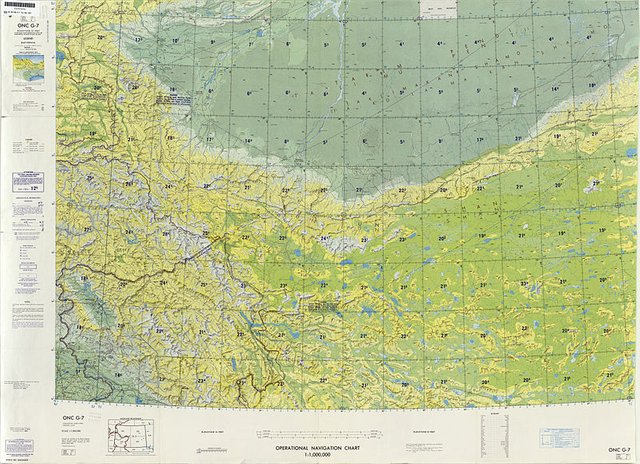
Navigation Chart./ Image Source: commons.wikimedia.org
Classification Based on Map Content
The huge variety of natural phenomena observed in our 3D world and the thousands of possible correlations between those phenomena as well as the numerous different uses of mappings produce a wide range of spatial information if combined. Despite the fact that all maps can be classified in categories based on scale or purpose and therefore can be included in the space between Thematic Maps and General Reference Maps, it is often practically useful to classify maps based on the type of content they provide. Steemit Based Classification. There's a high chance that older permanent maps were the charts used in land register systems that were established and would represent a catalogue that included the names of land owners and precise spatial information regarding their properties' localization. Those charts also referred to as land register maps would also represent the geographic correlations between neighbour plots of land. Such kinds of mappings are still used nowadays in almost the same way as they were being used thousands of years ago.
Let's not forget how land register systems are utilized for the accurate and efficient imposition of taxes. That said I think it is fair to say that it's pretty obvious why we still use such charts nowadays. Maybe the Blockchain Technology could change that in the future. Another broad category of large scale maps that are directly related to land register charts and generally used in civil areas is known as blueprints. Those are detailed mappings that depict buildings, road networks, property and administrative boundaries etc. Blueprints of civil and rural areas are usually large scale maps providing enough space for all sorts of spatial information to be precisely included and accurately depicted in order to serve the maps purpose efficiently and provide effective supervision and deep understanding of the included geographic entities' shapes. Large scale blueprints are frequently used as the bases for the development of topographic maps in advanced countries of the western world that possess meticulously designed cartographic schedules.
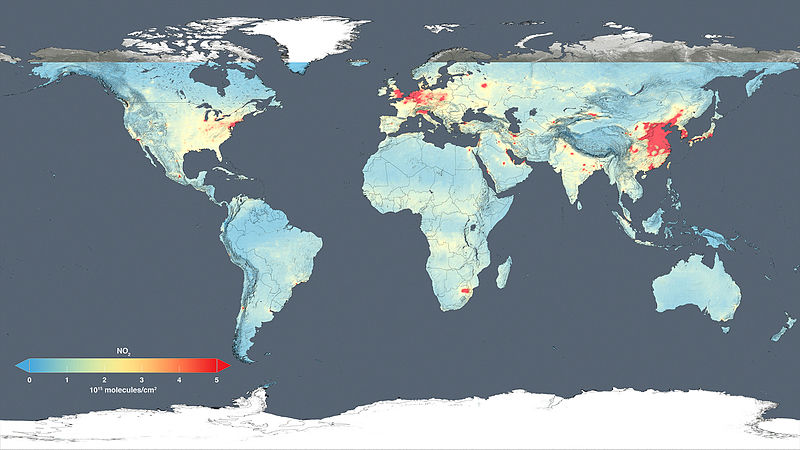
Image Source: commons.wikimedia.org
Let's also keep in mind that there are no actual limitations in place regarding the multitude of categories that can be created and utilized through the classification of maps based on content included. Thus, there are various types of maps based on content, such as geological maps, maps of the subsoil, maps of the substrates, maps concerning population, maps of transportation systems etc. However it is worth noting at this point that it would be a wrong assumption to consider all those categories mentioned above identical. It is possible to spot more and bigger differences between a large scale map that was designed to demonstrate and provide information concerning the internal composition of a given area of the Earth's surface, and a small scale map that was built to depict the tectonic plates and substrates of the same area. Even though both are geological mappings there might be bigger differences than there would be between two entirely different kinds of maps. This goes to show that Cartography as a scientific field is irrelevant of content. I suppose you've realized that by now.
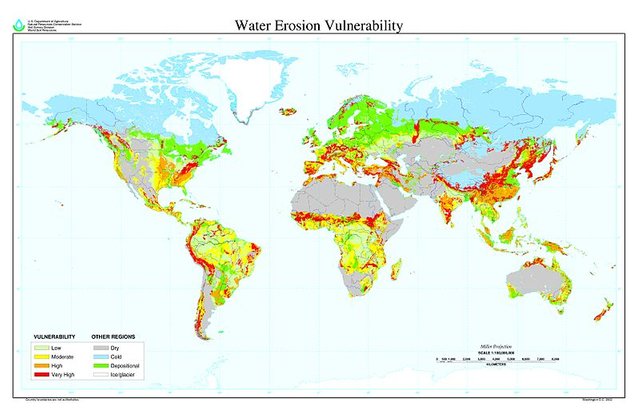
Image Source: commons.wikimedia.org
Alright, that's it for today folks! Hope you managed to make it till this point! This brings us to the end of this second part of this Introduction to Cartography series. As promised in the previous introductory post, I will be making a third part regarding this introductory series which will be published within the next 3 days. I will try to keep things simple and fun to make these posts less boring than they might sound, however I will also start sharing advanced technical information in order to entertain the steemnerds out there. These posts are still introductory, however they might start getting too nerdy, so follow me at your own risk! :)
IMAGE SOURCES:
REFERENCES:
University Textbooks & Course Lectures:
Χαρτογραφία Ι/Cartography I - TSOULOS LYSSANDROS(National Technical University of Athens, School of Rural & Surveying Engineering, Course Lecture Notes)
Xαρτογραφία ΙΙ/Cartography II - NAKOS BYRON(National Technical University of Athens, School of Rural & Surveying Engineering, Course Lecture Notes)
Ψηφιακή Χαρτογραφία/Digital Cartography - STAMOU LEDA, SKOPELITI ANDRIANI(National Technical University of Athens, School of Rural & Surveying Engineering, Course Lecture Notes)
Internet Links:
https://www.britannica.com/science/map/Map-scales-and-classifications
http://axismaps.github.io/thematic-cartography/articles/thematic.html
Thank you for your attention!
Hope you enjoyed this post and did learn a thing or two.
Follow me and stay tuned for more engineering blogs.
Highest Regards
@lordneroo


Maps though! I can't forget how much cane my small buttocks received from my Geography teacher back in high school because of this topic - Map reading !
Map scaling especially is one I can't forget easily either. Magnification and Reduction were daunting then, I'll always get the calculations wrong and was never spared till I got it right.
This post is more elaborate though..The classifications...I learnt a lot.
Thanks and well-done
Lmao!
Thanks for reading and leaving a kind response!
Lol. You're welcome. It was a worthwhile read.
Hi @lordneroo, thematic maps appear to be another form of what is called in data analytic's heat maps. It seems that data analytics borrows somewhat from cartography because I guess the end game is similar, ie to give the user a simplified view of the available data. Anyone thanks for the effort you put into this, it was a great post.
Hey @terrylovejoy, thanks for reading!
You are absolutely right, heat maps are definitely thematic maps as they demonstrate different classes of a continuous phenomenon. The demonstration of reality in a simplified way that includes geographic precision is the primary objective in Cartography.
I'm glad you enjoyed my post, thanks for the kind words.
Highest Regards
@lordneroo
Had a little idea about thematic maps..!
But those navigation charts seems like Alien things..! 😃
Btw good follow up of the first introductory post..! 💪
Best regards..!
Hello @christinaa!
I have to admit that's what I thought as well in the beginning! :P
However things make much more sense if explained properly!
Thanks for reading and leaving a kind response! :)
Highest Regards
@lordneroo
yep nd ur article was detailed enough..!
keep the good work going..! 🤗
@lordneroo there are various map types. There ised to be a book here called the atlas. I so much love this book due to its maps. It has different types of maps. I will be following this series now to get some interesting things on maps.
@adetola Hey there!
Atlases are encyclopedias that include various kinds of maps along with catalogues with all sorts of spatial information. I love reading those as well!
Thank you for dropping by! I'm glad to know you'd be interested in finding out more about Cartography.
I am glad i stopped by.. Expecting the next series.
@adetola Thank you for your kind words!