He did the monster math! Using steem monsters to explain microbial ecology and principal coordinates analysis (PCoA).
One of the games I play with my kid is 'What's the same? What's different?' This is great for learning, but it's not child's play. In fact, I use The Fancy Grown Up Version all the time in the microbial ecology facet of my day job. I'd like to explain it to y'all using @steemmonsters cards.1

On comparing apples and oranges. And melons. And pumpkins.
I'll promise we'll get to the cards in a bit, but I'd like to use a simpler system to get everyone on the same page.
I'm guessing many of us have heard a variation on the phrase "it's like comparing apples to oranges", implying that no meaningful comparison can be made. Well, you can talk about the differences between them and things get even more interesting when you throw a few few more fruits into the basket.2
Multidimensional data has nothing to do with alternate universes
Let's a play a quick game. Of the foods shown below, which are alike and which are different?

How did you decide? Color, shape, taste? Maybe if they grew on trees? Caloric density? It turns out that our food has a lot of different characteristics we can compare by and each one of those qualities may be reasonable, depending on what you're interested in. These things are multivariate and the comparison we want to do is multidimensional.
If you had only one variable, let's say color, you could arrange them along a line (axis). Not only that, but you can use the color spectrum to decide just how far apart they should be (distance metric). You could do the same thing for something like sweetness. In fact, you could put both variables on axes at 90 degrees to each other (or be all fancy and say orthogonal), then arrange them by both color and sweetness on a two-dimensional plane like this.
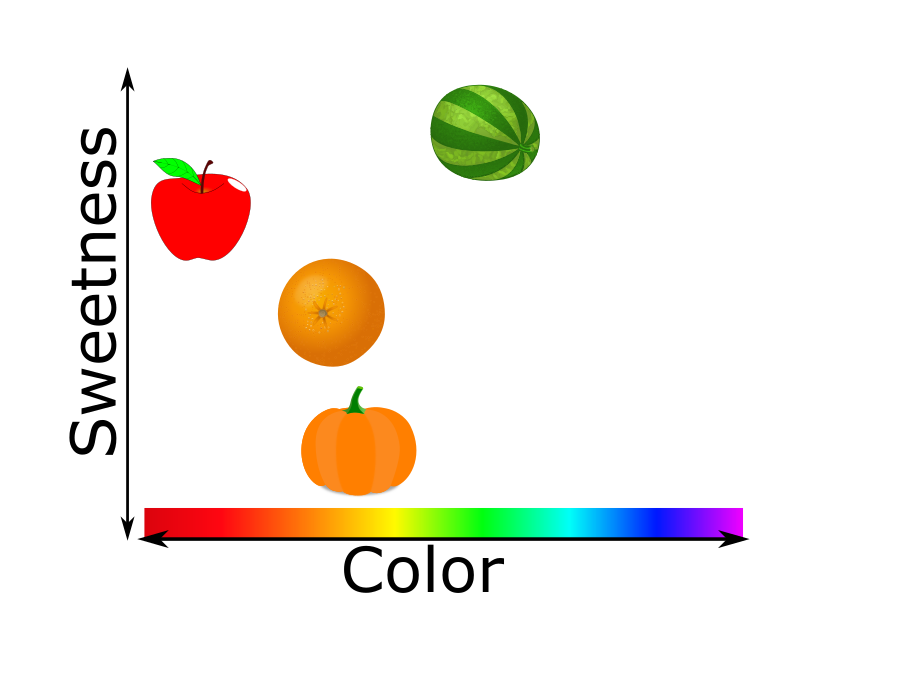
Intuitively, the stuff that appears closer together should be considered more 'alike', all other things being equal.
"All other things being equal" is jargon for "you can screw up my assertion if mess with this"
This is a multidimensional problem, by definition there are other things and they are probably not equal. You need to add more axes, 1 for each dimension.
You can probably imagine adding a third axis will make a cube that you can place our fruits into, but how would you envision a plot with 9 or 10 or 1000 dimensions? That's where dimension reduction and ordination come in, and we'll get to those in a little bit, but first let's stop putting "Descartes" before "the cards"3
Release the Steem Monsters!
For those of you living under a rock without wifi, @steemmonsters is a recently created (and incredibly popular collectible card game implemented on the steem blockchain by @aggroed and @yabapmatt. You can't battle with them yet, but that hasn't stopped people from buying booster packs and trading until they acquire full decks. Thanks to a nice API, the transparency of the blockchain, and the efforts of @blervin, we can see all the card details and even estimate the rarity of various cards.
Let's use that data along with the basic characteristics of the cards to come up with some custom distance metrics4 and generate an 2D PCoA ordination plot using R.
Card characteristics
Every card has a bevy of characteristics, including:
- Type: Summoner or monster. As I understand it, summoners will call monsters into being and may provide a deck bonus. The monsters do the fighting.
- Rarity: Different cards have different chances of appearing in a deck, and rarer monsters are probably more powerful.
- Level: Each monster can be leveled up, either through battle experience or by merging duplicates.
- Splinter: The backstory is being developed through various contests, and it looks like a sundering/reunification mythology with 'Splinters' associated with various color-coded elements.
- Foil: There are now ultra rare foil cards which have no functional difference, but are intended to be extra collectable
- Basic stats: Looking at the teaser image, it appears monsters will have a attributes like attack & defense
- Special skills: Monsters and summoners will also have certain skills (e.g. first strike, armor-piercing)
Distance metrics
I'll go through each of the characteristics and work out a distance metric. I've selected the order in which we do this to aid in explanation.
Level
Each card can level up as it gains experience. In terms of distance metrics, this is really nice because each level is just a number on a number line and, right now, we can assume they are equally spaced - a level 4 Frost Giant is about twice as strong as a level 2 Frost Giant, even if it takes many, many, more exp to level up from 2 to 4 than 1 to 25. This means that the scale is on a linear interval. One little detail is that you can't have fractional level. No level 6.283185 Tau warriors for us. Formally, this means that although we have a numeric metric, it is is discrete rather than continuous.
If we were to plot cards on just this axis, we would see something like:

Stats
We know each monster will have a value assigned to things like speed, attack, and defense. Each of these are their own ordinal, linear variable, and we can treat them just like level. The biggest problem is we don't know the stat values for each monster, so we would have to make up numbers.
(Spoiler, without stats or skills, we will see that a Level 1 Gobin Shaman, Giant Roc, or Kobold Miner are essentially the same card.)
Rarity
There are four different rarity levels: common, rare, epic, and legendary.
Much like level, rarity is numeric and discrete. However, It is likely not linear -the difference between a common and rare is not the same as the difference between a legendary and epic. Although we don't know the exact differences, we can probably use their drop rate as a surrogate.
We can actually estimate out what those drop rates are: 66.6, 28, 4.4, 1 as you go up the rarity list.
Our plot of rarity would look something like this:

Splinter
The next category gets a little harder. Each card has an associated color-coded element, known as a Splinter. These are: red/fire, blue/water, and so on.
Now we come to some initial difficulties. First off, these aren't numeric, they are categorical. They aren't even sortable into a meaningful order (ordinal), instead, they are nominal.
Just for now, let's say that all differences are symmetric - the differences between all pairs of different splinters: (Fire, Water), (Fire, Earth), (Death, Water), etc. are the same value. This might change as we learn more about play style. To an old gamer, it makes 'sense' that Fire is more different from Water than it is from Earth. We can adjust this for asymmetry later if we need to.
Because they aren't ordinal, we don't really have an axis, instead I want to introduce you to something called a distance matrix. If you want to compare n things, you set up a grid of n columns and n rows where each thing gets a slot in a row and column. The value at the intersection of row A and column B represents the distance between A and B, with 0 meaning "identical" and 1 meaning "as different as possible". For a simplified 3-Splinter system of Fire, Water, and Earth, you would have a matrix like below.

Notice how everything is 'mirrored' around the diagonal running from upper left to lower right? We usually represent it as a triangular matrix:

According to that, distance between Fire and itself is 0, Fire and Earth is 1, etc. If we wanted to introduce that asymmetry I mentioned before, we could make the matrix read like this, assuming that Earth and Water 'get along' and Fire and Earth are 'somewhat opposed'.

Type
Until we know more, I tend to think of summoners as the equivalent of 'land' in Magic6.
Much like Splinters, type is categorial. Unlike splinters, there are only two of them (binary )and we can be pretty sure they are not symmetric. Essentially, you will need both in your deck, but you probably don't want an even ratio of summoners to monsters. While in Magic the ideal ratio is a deep, dark science, full of opinions, we don't know enough to say anything sensible, so let's just use a 25% summoner ratio. We can come up with a sort of ordinal metric and keep them from being nominal
Ordering cards by type here means that relative to an arbitrary point, a monster will be X times as far away as a summoner, similar to the uneven spacing for rarity.
Skills.
Skills are going to be very interesting for differentiating cards. Most likely they'll be binary (either you can throw a Hadouken or not), some will be more rare than others (@effofex used dig, it was super common!), and some will be mostly useless (Cantrip) while others will be absolutely devastating (1-Finger Death Touch). Basically, each skill will be a variable with either the value 1 or 0, the distribution of 1's among monsters will be larger for more common skills, and the 'importance' of that skill needs to be represented (weighting)7.
Intro to ordination
Cool, so now we've got a bunch of variables to play with. Like I hinted at before, there's no easy way to visualize all the differences. What we can do however, is use a technique called 'dimensional reduction', but a more illustrative word for it is ' projection'.
Imagine we had 3 dimensional data, like a bunch of balls floating in space these balls floating around. Now imagine you wanted to reduce its dimensions and show it in 2d. One thing you could do is shine a spotlight on the balls and just show the shadows - BOOM 2D data. The equivalent holds true for reducing any number of dimensions and @alexs1320 wrote an article a while back which has a really great image showing this.
The cost is some lost information. Lost information? Yep. You're going to lose information. Look at what you get when you project light onto this '3D ambigram' from different angles:

Never fear though: we lose different amounts of information depending on where we shine the light and we have ways to measure how much information is being lost.
The trick then becomes figuring out the best way to light up stuff while retaining the information we want (this could be the most information, one that preserves the effect of axes or keeps things as simple linear combinations) etc. There's a whole world of these things and they're often grouped under the name 'ordination' methods. A full survey is wayyy out of the question here, but if anyone's interested, I can't recommend enough Legendre and Legendre's book on numerical ecology.
For what we're doing here, I'm going to choose the relatively straightforward and incredibly-common in ecology PCoA (Principle Coordinates Analysis). Here's how it works:
- Create a distance matrix for each pair of items you're looking at (in our cases, each card to card comparison)
- More on how we can create this distance matrix from our combined distance metrics in a bit
- Pick an arbitrary first point and say it's at the center of an n-dimensional universe.
- Pick a second point, look up its distance from point 1 and place it that far away. Congratulations, you've added your first axis/dimension.
- Pick a third point, look up its distance from points 1 and 2, and find where that fits. Now you've added another dimension.
- Repeat this pattern until all points are 'placed' in a universe with more dimensions than even Yog-Sothoth would approve of.
- Flatten all these points to 2 or 3 dimensions, usually by rotating and rescaling all those axes until you achieve the maximum explained variance
- The PCA section of the blog post I reference above goes a bit into the details of this. If you really want to understand what's going on, I highly suggest reading @dexterdev's excellent (and very approachable) article on eigenvalues and vectors. Those things are incredibly important for this transformation and while I've understood the mechanics of calculating an Eigenvector and its properties for quite some time, @dexterdev's post was the first time underlying reason why they are important.
- Make pretty plots of the 2 or 3 dimension reduction and try to turn data in knowledge by looking for patterns
Gower's distance and you
I promised I'd explain how to develop a distance matrix from a bunch of distance metrics. The real difficulty is not the math, but justifying your choice behind it. In fact, a lot of what plagues ecologists these days is choosing and justifying your method8.
Let's start with a really simple case, the fruits on a 2d color-sweetness graph. The distance matrix would have the distances between each pair. Sounds easy enough, those are just the good old (x2+y2)1/2, right?
Well, yes. And no. That's one possible distance metric, the Euclidean distance (or "as the crow flies"). It turns out there's also a lot of other reasonable distances - imagine you were a taxi cab running along the streets of New York City. You'd be limited, generally, to moving vertically and horizontally along a grid and the distance you would travel would be (x+y). This is known as the Manhattan distance, it's totally legitimate, and may even be more appropriate for some situations.
Things get even more complex when you start adding non-interval data, especially stuff that isn't necessarily ordinal, like our Splinters.
One approach, which I'll use below, was developed by Gowerref and can handle those cases. Essentially, it figures out how to rank everything on a scale of 0 to 1, then combines those ranks into one distance.
Implementation and Results
One of the great things about a thriving software ecosystem is that you don't have to muck about with the underlying stuff. I suspect I could implement PCoA and Gower's distance in base R and maybe it wouldn't be too terribly buggy and inefficient. I also suspect I wouldn't learn much vs the opportunity cost of spending that time on other learning activities. Fortunately, R is rife with ordination methods. What's more interesting here is setting up the data so that R can do its thing. This essentially means writing up those distance metrics we came up with in a sensible form and feeding them to the correct algorithm.
In very short form, here's what I did:
- read in the monster cards from a csv
- assign values to our different characteristics
- use the
daisymethod of theclusterpackage to create a distance matrix - feed that matrix into the
pcoamethod of theapepackage to create an ordiation - plot the first two axes of the ordination using
gpplot2
If you're really interested, you can grab the code from github and take a look.
A plot, without further adieu
After all that work, we get a nice little ordination plot:

There's a couple things going on in this graph that I'd like to point out. First off, let's talk about what we're looking at. Each point represents a single card. The color corresponds to the associated Splinter, the shape represents the card's rarity, and the color of the border denotes whether it's a summoner or monster. Level was left out, since it really doesn't tell us much about the other differences.
The first thing to note is that the cards form really tight bunches (clusters). In fact, they are so tightly grouped, I had to add a 'jitter'9 to keep individual clusters from looking like a single card. This is because, as I hinted at earlier, the Splinter variable really doesn't make things that different, so all common monster cards were kind of overlapping. Related to this is that the first two axes explain over 90% of the variance - since most of the difference is not caused by Splinters and it doesn't appear to be represented in the first two dimensions.
The next thing to notice is that summoners are very different than monsters and (except for Selenia Sky) are all bunched together. This is because, unsurprisingly, rarity really drives differences right now and all the summoners besides Selenia are Rare. Related is that the clustering for monsters is also driven by rarity - moreover, the uneven distances between rarity are reflected in the increasing separation between clusters.
The final thing that stands out is that there is one outlier. I suspected who it was and had the code label their point. Selenia Sky is a Legendary Summoner, which is the rarest combination. In fact, it's as far as you can get from a non-purple, common monster, and we see that in the plot.
You can also see how the legendary purple monsters are ever so slightly closer to her than their brethren - these were some of the few cards which did not have to be jittered to avoid overlap. One really neat thing is that without any other knowledge than the this graph, you could probably guess Selenia was a fairly special card (but not her quality, she could be uniquely crappy, based on the graph, too). As it turns out, the most expensive card sold to date, by @oliverschmid is, indeed, a Selenia Sky Gold Foil card.
I've got skills, they're multiplyin' // it's electrfyin'
Just for fun, lets add a set of 5 skills to the cards to see how that could shake things up. Since we don't have any skill data, I'll just name them Skill 1, 2, 3, 4, and 5. Skill 2 is very common, appearing randomly in 40% of the cards. Skills 1, 3, and 4 are rarer, appearing in 10% of the cards. Skill 5 is very rare and really powerful, appearing in just 5% of cards and given extra weighting in the distance matrix.
When I plot that ordination, we see this:

Much more varied, right? Not only that, but Selenia is no longer lonely, since rarity isn't the overriding factor. Apart from skills making the game playable, this points out how the cards are going to be much more interesting as time progresses.
But wait, there's more!
This type of analysis could also be extended to decks; since you can derive values for differences between cards, you can use those values (perhaps combined with the abundance of particular cards, to measure how (dis)similar a deck is. This is exactly what microbial ecologists do when they try to determine how different two microbiomes are.
In fact, there's a lot of parallels. You could use other ecological methods to determine which cards are most responsible for differences in decks and win rates (differential abundance) or determine which cards are ultra important or have interesting synergies (network analysis/keytstone species identification).
It even goes beyond that. There's no reason these methods only work in ecology and card games. They (or related analogs) are also used in textual analysis, business analysis, hiring baseball players, and even the Steemhunt voting system.
Once you get the abstraction and math correct, it's amazing how many problems you can address, and this is part of what @lemouth and I were geeking out about a little while ago.
In closing, I'm well-trained on using some ordination methods for ecology. I'm not an expert at deriving completely new distance metrics, and I'm certainly not a collectable card game expert. I welcome any feedback, especially if I made a boneheaded mistake somewhere.
Footnotes
1. Enlightened self-interest alert. I'm also doing this to understand PCoA at a deeper level. I use it all the time and understand a bit of the mechanics, but the implementation is abstracted away in function calls to some R packages (as it should be). By having to write about what's going on under the hood, I'm planning to enact phase three of read it, do it, write it, teach it.
2. Pumpkins are fruit. But since I now know you're a pedant (even worse, a botanical pedant), I'll cop to the fact that apples aren't and I'm not quite sure if melons (which are berries) count.
3. Sorry.
4. For those in the know, I'm speaking loosely here and simplifying by not going into distinctions between similarity, dissimilarity, and distance. Budding ecologists, you should learn about that.
5. Also, amazingly, this assumption it makes it well suited for the distance metric I want to discuss.
6. Disclaimer. I've played maybe 12 rounds of Magic in my life. And by all accounts, I'm terrible at it. I did play a ton of Yu-gi-oh online and that Fox animation Android game, not sure if that helps or hurts my street cred.
7. There's also issues of things like 'rock, paper, scissor' skill sets and interactions between skills. These can be handled, but may need a different kind of analysis.
8. I've actually argued that unless you need to tease something subtle out, that your should run your analysis with multiple methods, and if the same general story pops out despite different different assumptions and biases, you've probably got a solid result.
9.No really, that is the technical term.
Very cool, my first instinct with the fruit was to colour code it and then by the way it grew after you talked about it and then I was like what about fruits v veggies, this was all before you moved onto the Steemmonsters and blew my mind lol..
Glad you liked it!
I don't know where you find the time--must have a magic machine that creates hours. This post (which I haven't read yet) will entertain me tonight when I'm babysitting for my daughter's pets (2 dogs, 2 cats). I'm sure the post will tax my brain, but judging from your past blogs will be worth the effort.
Part II of my comment: I got lost, but I think it had more to do with the Monster cards than your discussion. I did enjoy learning (approximately) about plotting relationships between objects in a way that provides order, that can be described, quantified and communicated to others. I was interested enough that today I will probably be looking up information on PCoA.
To sum up my response: You really do know a lot, about a lot of things, and you don't retreat behind jargon. You speak English, instead of technicalese :)
It would be nice to have a time generating machine. This post has been in the works for most of the month. I suspect I really need to work on limiting scope-creep.
I didn't notice part II.
I am glad you were able to follow along and even more glad you were inspired to read more.
Thank you so much! This is a major goal in my writing, and I'm very happy to see it working.
The next post I read where the writer complains there's nothing but crap-posts on Steemit, I'm going to point them here. I can't even imagine the mind it took to write this. Even the title is a gem.
I'm just going to sit here for a while and marvel ... until I find the strength to move on. Totally awesome.
Thank you for such a kind comment! There's a lot of good stuff on here, but it does unfortunately take a little digging to find some days.
Congratulations! This post has been chosen as one of the daily Whistle Stops for The STEEM Engine!
You can see your post's place along the track here: The Daily Whistle Stops, Issue 203 (7/22/18)
The STEEM Engine is an initiative dedicated to promoting meaningful engagement across Steemit. Find out more about us and join us today.
I laughed a lot in reading your post (especially with the footnotes :D ).
You can definitely be sorry here :D
This made me laughing too :D
I figured contrition would be a good idea to thwart anyone coordinating a plot to have me quartered.
I was worried no one would catch that!
Please don't underestimate me ^^
That's a great way of explaining both PcoA and SteemMonsters! And it saves me reading up on the latter, as I want to try the game myself, but could't get myself around the initial effort of starting yet.
I'm glad it made sense.
This is a good time to get started, the game is still in a simple state and I gather that the starter cards won't always be available.
Congratulations! Your post has been selected as a daily Steemit truffle! It is listed on rank 12 of all contributions awarded today. You can find the TOP DAILY TRUFFLE PICKS HERE.
I upvoted your contribution because to my mind your post is at least 13 SBD worth and should receive 134 votes. It's now up to the lovely Steemit community to make this come true.
I am
TrufflePig, an Artificial Intelligence Bot that helps minnows and content curators using Machine Learning. If you are curious how I select content, you can find an explanation here!Have a nice day and sincerely yours,

TrufflePigThis post has been voted on by the steemstem curation team and voting trail.
There is more to SteemSTEM than just writing posts, check here for some more tips on being a community member. You can also join our discord here to get to know the rest of the community!
Congratulations! This excellent post was chosen by the new curation initiative of the @postpromoter content promotion service to receive a free upvote!
This post exemplifies the type of great content that we at @postpromoter enjoy reading and would love to see more of on the Steem platform. Keep up the good work!
Excellent post. The footnotes alone are most worthy of an upvote!
Quick question:
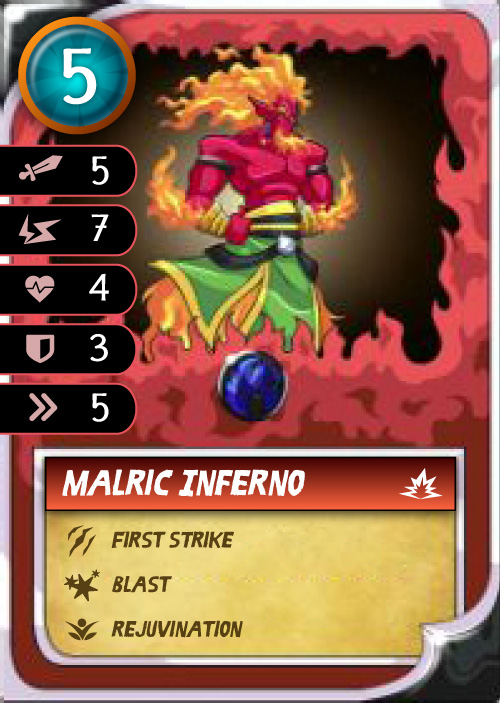
In your last plot, what is the lone triangle I've circled in red here (is that skill 5)?
Why is this all by its lonesome (noting it is legendary too)?
Thanks again!
Fortunately for me, I still have R open. Short answer is, you're right!. It's a Frost Giant, which was one of the 3 which randomly received Skill5. The other two are Malric Inferno and Medusa, both of whom are hanging out at the far right, mid-line, and neither of which are legendary. (Also, thank you for the comment on my footnotes, I was worried they'd be too much.)
Postscript, sorry about the terrible table formatting.
Ah cool! Nothing like a bit of randomness to upset the balance (re: Malric and Medusa). Thanks for this explanation.
Footnotes are awesome and help tell the story! Especially #8. We all have bias so sensitivity analysis is key to keep things "open-minded". Well of course with clearly defined assumptions... Cheers!