Steemit News - Infographic

Courtesy of @steemitguide here is the 2nd Edition of Steemit News Infographic. This will be a weekly post, representing Steem(it)'s growth in an easily digestible, graphical format. We will be making some amendments next week to incorporate feedback we received in the last post. We intend to concentrate on presenting different data points each week, so we can all get a good over view of how Steemit is developing. This post is a bolt-on to my Weekly Statistics Post which can be found;
Past Weekly Post: Week 7 / Week 6 / Week 5 / Week 4 / Week 3 / Week 2 / Week 1
Past Edition of this Post: Edition 1
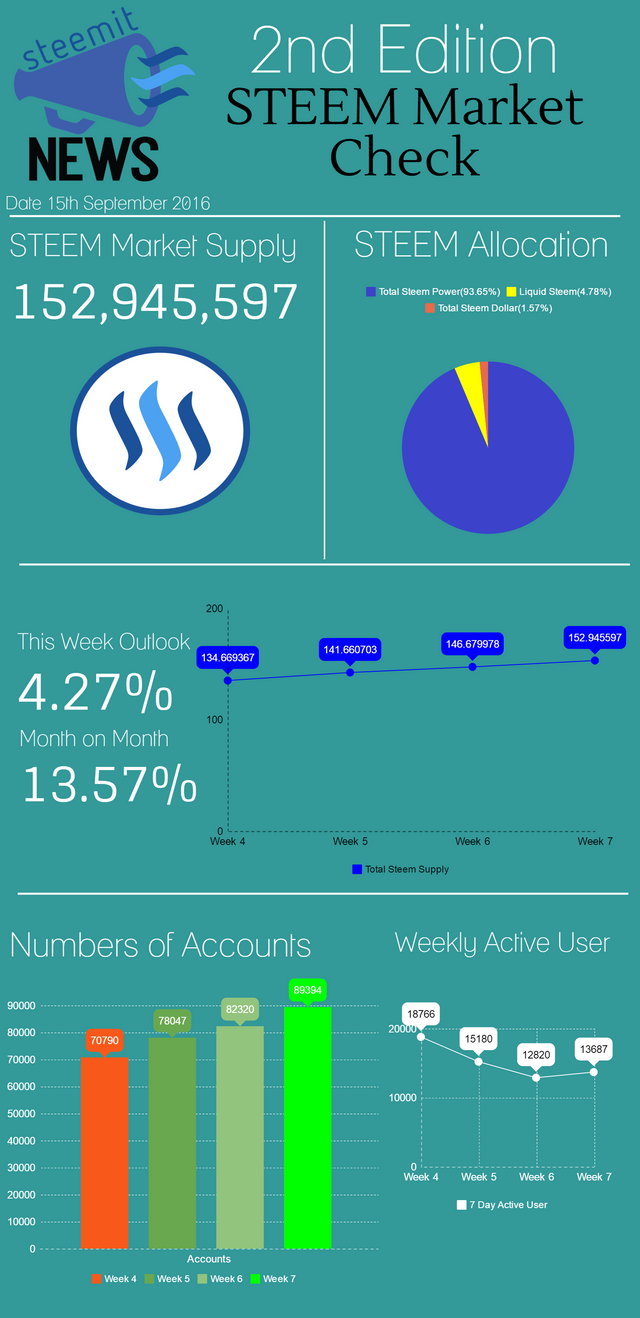
Steemit News Infographic

Feedback as always would be much appreciated
I'm a very visual kind of guy; I like seeing graphs and charts rather than just raw numbers. Love the format here, this is a great way to get a snapshot of how things are trending over time. I'm starting to think of you as the Steemit Stat Guy!
Nice! You might include some simple stats on SBD as well like supply and SBD/USD graphs. Thanks for putting this together!
Thanks for the feedback @biophil :)
Well the uptick in active users this week is good to see! I like these posts, they are a great way to quickly see and understand the data and also draw meaningful conclusions related to previous week's.
Glad you find this useful @justtryme90 Myself and @steemitguide will endeavour to improve this week on week...
Accounts Numbers go up but weekly users go down. Interesting correlation.
@steempowerwhale 🐳
🌞 upvoting your lifetime dreams!
Account numbers are bloated by miners, signing up for the user bonus. See this post by @dantheman
What is required for an account to be counted as 'active user'?
I am not completely sure. I'm assuming it's an account which has taken an action on the Steem Blockchain, but would be happy for someone to step in and shed more light on the matter..
I would say that, the 7 Day Active User Metric is the most accurate measure of users on the platform.
This is a great post and nice stats. Happy to upvote. Now following and looking forward to reading more of your posts. Catch us also on Twitter Twitter✔. Cheers. Stephen
Thanks @stephenkendal
You are very welcome. Cheers. Stephen
Stats look pretty slick! Thanks for the info:)
I wonder how the user engagement rate compares with other social media.
@gravitygirl I have seen posts on this in the past. This one is the one which came to mind here. I unfortunately haven't seen anything posted more recently...
So what exactly does this all mean, alot of us really know nothing about charts, and graphs! It doesnt look good to me. 🤔
There has been a number of reason why User Numbers and other metrics have been inflated/deflated by various changes to the Steemit Protocol. Steemit is still growing, there is nothing to be concerned about of that basis. These numbers will become more a more accurate reflection of reality as we move forward.
The price of Steem has been under pressure for sometime. However, over the past 10 weeks, Steem Market Cap is still up 400%. The market just got overheated, and the price is just rebalancing...
Overal, we are still very early in the Steemit Journey, however I believe now is a good time to start following these metrics moving forward, to give ourselves the best reflection of where we may be heading in the future..
Great presentation. I find the up-tick in weekly active users to be very encouraging. regarding the continued price decline, I suspect we are getting close to the bottom of the dip. I am optimistic that the next edition of the Steem Market Check will show an increase in Steem price starting inthe next week or two.