Steem(it) Statistics Week 4
This post is a weekly, evolving post, analysing Steem(it) by numbers and deducing trends of interest for this project moving forward. Apologise for the late post, I was away on business over the weekend, however all the figures are from Saturday afternoon as usual
This week, I can provide the first Month on Month results for Steem(it) statistics along side the normal Week on Week changes. Over the coming weeks (probably starting Week 6), I will have collected enough results to begin to provide charts to illustrate Steem(it)'s growth trajectory, and how users interactions are evolving.
The Steemit platform continues to evolve and I have been seeing some marked improvements in Variety and Quality of posts. That's being said, I couldn't have picked a more subjective way to start a statistics post, so let's get down to the nitty gritty of Steem(it) by numbers this week.
I would also invite anyone with special knowledge of Steem(it) to provide analysis (who, what, how, why, witness updates...) of my findings, and I will add this information where relevant to this post. There has been some very valuable contribution to this post in the past few weeks which is much appreciated.
Steem(it) Statistics Week 4 Highlights
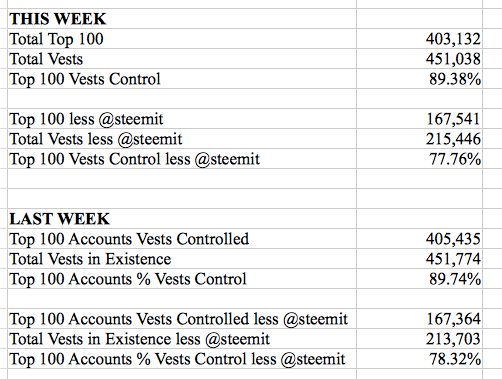
- Top 100 Accounts Control of Steem Power Continues to Fall;
Whether you include @steemit account in your calculation (-0.36%) or not (-0.56%), the results are the same, another week on week fall in the Top 100 Steem(it) Accounts Control of Steem Power. Steem Distribution is still ongoing, and I expect to this result recreated next week. - User Base Growth Largely Flat Week on Week:
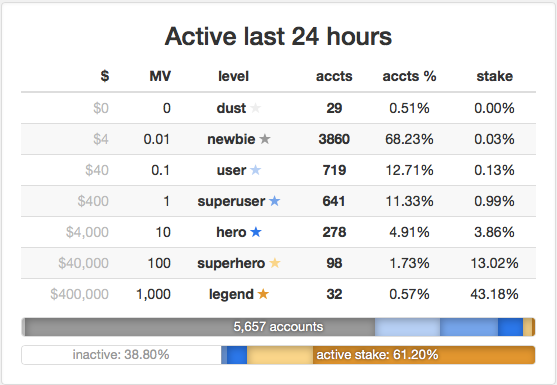
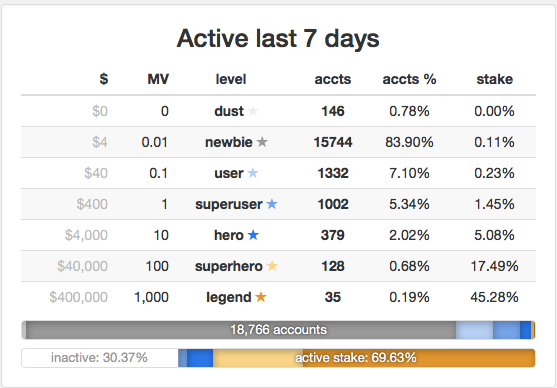
We can see there has been an increase in user accounts, whilst a small decline in Weekly and Daily active users. Obviously a single week is not significant, however this will be an interesting metric to watch moving forward. - Post's Up 28% Week on Week
A positive result, and a good reflection of user base interactions on the increase - Internal Market Volume Falls Dramatically -80%
This could be the trigger for the reinstatement of liquidity rewards. However, there have been no obvious pains in the Steem market place from this fall in volume. It will be interesting to see if we hear anything on this topic over the coming weeks...
NOTE: Many of the Month on Month figures have been thrown out by various updates which have reduced certain Bot activity over the last month. I expect to see a truer reflection of these figures in the weeks to come.
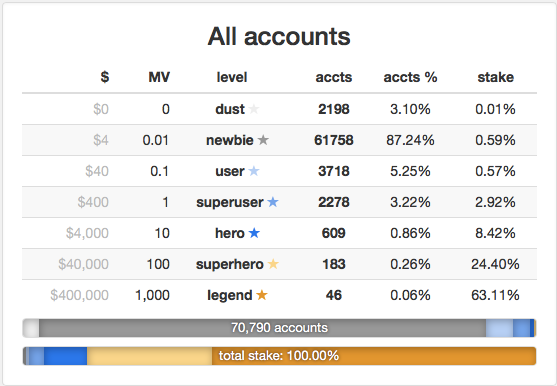
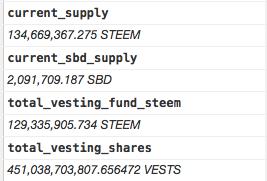
The Statistic Table:
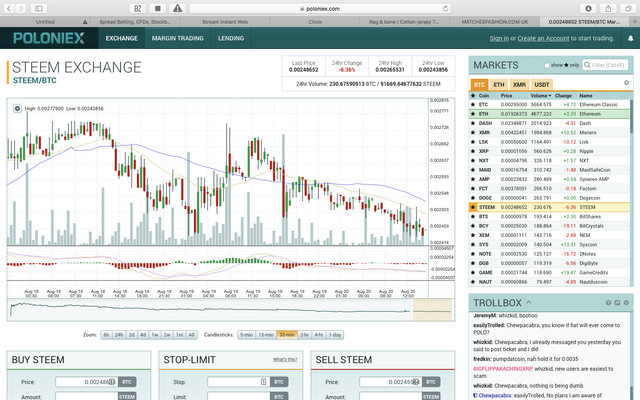
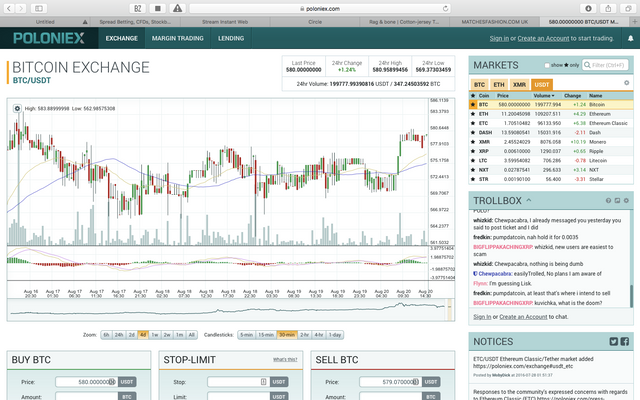
Visual Sources
Weblink Sources
https://steemd.com
https://steemd.com/richlist
https://steemle.com/charts.php
https://steemit.com/market
https://poloniex.com/exchange#btc_steem
https://poloniex.com/exchange#usdt_btc
https://coinmarketcap.com/currencies/steem/
https://coinmarketcap.com/currencies/steem-dollars/





I hope we do!
Very detailed presentation. Steemit has a lot of room to grow, and the next burst will likely come so long as user base growth continues to accelerate over the next year and beyond.
Digital currencies and Bitcoin will only stand to benefit from Steemit's increased adoption with mainstream users. Thank you @hisnameisollie
I wonder if this idea would help the internal market. We could offer a goto bittrex button from the market page in exchange for them adding the Steem -sbd pair. Then we would t need liquidity rewards.
https://steemit.com/steem-ideas/@dennygalindo/let-s-get-a-steem-sbd-pair-on-bittrex
Seems like a reasonable idea...
so how do you actually get the numbers for all the accounts... im assuming you don't go through and add them up manually... is there some list that gives all the numbers. What id really like to see is SD and mean
I currently pull all the numbers manually from the sources above and put them in a simple spreadsheet I have made.
I'm pretty sure @jesta is working on automating the whole process in one place though.
You can see SD on Steemd.com. Right hand side on the home page.
i shoulda been more careful with the abbreviation, i was thinking standard deviation, not steem dollars.
In terms of getting a real picture of concentration, seeing how much SP is within X standard deviations from the mean would give the clearest pictrue, IMO
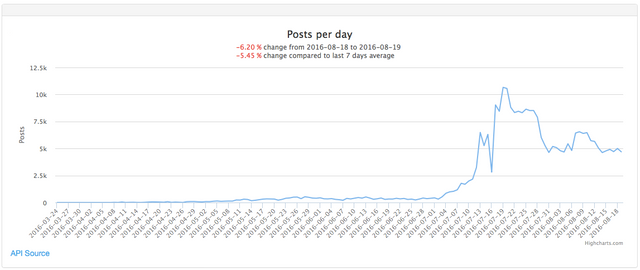
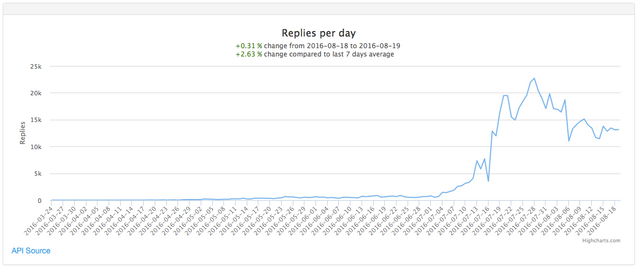
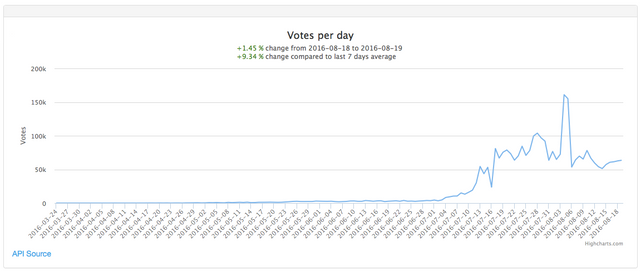
I wasn't here during that time period, but what accounted for the massive spike in posts and replies from ~7/22-8/05?
Great stuff @hisnameisolllie
@daut44 It was mostly an increase in user base, (and some of it was down to Bots, who's activities have since been reduced)
Yes, the implied question was why wasn't the spike sustained while user base has continued to grow?
But yes, that makes sense, when I've seen older posts, now flagged bots were rampant in the comment section.
I see. What happen, IMO, Both Bots and User Base exploded, but then bots activity fell as User Base continued to grow. This caused the sideways chart move. A true reflection would be continued growth..
yeah, that was when they started rep and started hiding bot comments. I'm pretty sure hidden bots like wang and issac.asimov don't count atowards that total when they vote or comment.
What I pay most attention to is how much total steem power is in the nextwork at any given point and its been growing at about 130million right now
http://steemwhales.com/?p=1&s=power
800 Steem are created every minute currently, 1.152m per day, 428,480,000 Per Year. 90% of that Steem is in the form of Steem Power Rewards..
actually, 100% of the created steem is in steem power. liquid steem (god i hate that term) can only be created by powering down or redeeming SD. All new steem created by mining goes directly into the vesting fund.
90% of it goes to SP incentives.
10% of it goes to new SP
but all of it is SP
I could not understand how to proof 800 steem per minute? If you calculate total supply diff between week 4 and week 3 from your table:
(134669367-128564154)/7./24./60. = 605.67, you've got only 600 steem per minutes. Any ideas?I am really anxious for this weeks report. Seems like even more whales are powering down. ( maybe due to your 90 percent post) perhaps this week you could project when (based on powering downs at Steemdown.com) we will reach the 90 percent level to encourage more power ups.
We need the price of steem to stop going down!
Thanks for sharing this. It is great to see all the numbers side by side like this.
https://steemit.com/steem/@sigmajin/this-biggest-reason-steem-prices-are-falling-the-arbitrage-sabotage-steem-dollar-teeter-totter
i have a theory on that (not that anything is ever going to come of it)
@jrcornel I think the reason the price is falling is that Liquid Steem is increasing rapidly +16% Week on Week. This is mostly down to Large Accounts Powering Down, and 'cashing in' some of their holdings. Expect this price fall to continue if user base doesn't increase rapidly enough...
Detailed and practical analyst. Сan already draw conclusions about the market trend coin and of the whole project. Thx!
Love reading your statistics, Steemit will only keep growing if the user base keeps increasing as well. See you soon on friday at the meet up! Alla x
Thanks @allasyummyfood Unfortunatley I'm in Austria on Friday. I thought @wingz told you.. You can count me in for London meet up 2.0 for sure!
ohh no way... what a shame, no he didnt! Yes for sure meet up two! how long you are going for?
Just for the weekend. Going to do this. I'll make sure Input up a post about it :)