Steem - External Indicators
There are many external metrics that we can use to monitor progress of Steem/it. In this post I will begin to examine Twitter activity, where and by whom the word Steemit is mentioned in the last 7-10 days.
- Do you Tweet?
- Would you like to see some stats on who the biggest Tweeters are?

For the last few weeks I have been discussing useful metrics, which I will shortly begin producing on a regular basis, to help monitoring the growth and development of activity on the Steem Blockchain.
Keep an eye out for my upcoming analytic reports which will show a view of the most useful metrics over one week time horizons.

Today I will take a deep dive into Twitter activity close to home.
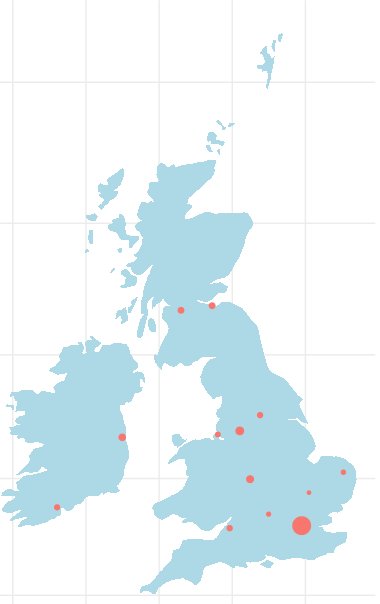
UK & Ireland (Tweets in Last Week)
I want to extend this analysis out globally but first I wanted to analyse the UK & Ireland in detail, and discuss here what may be useful to look at on a regular basis.

For this first graphic I have not covered the whole country (just the main cities). The main activity displayed on the graph centers on London, where not only the biggest number of tweets are coming from but also where the tweeters with the most followers are tweeting from.
Top 5 Twitter Accounts
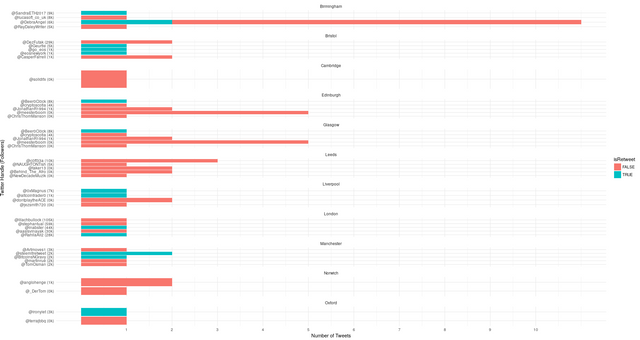
Lets take a look at the distribution of top tweeters in the UK. A lot of people tweet about Steemit but here I want to see which tweeters get the most exposure. I have created the top 5 out of the accounts with the most followers that have tweeted with the keyword "steemit" in the last week.
This graph is quite hard to read but it shows the number of tweets for the top accounts in each of the major UK cities.

- The twitter accounts with the most followers tweet only once about Steemit in this period on average.
The most interesting City in this graphic is London so lets zoom in on the top 5 tweeters there.
London to 5 Tweeters

- @lilachbullock with 105k followers has made a tweet about Steemit this week.
You can read about it in the following link https://twitter.com/lilachbullock/status/955453394029891584
Daily Numbers of Tweets
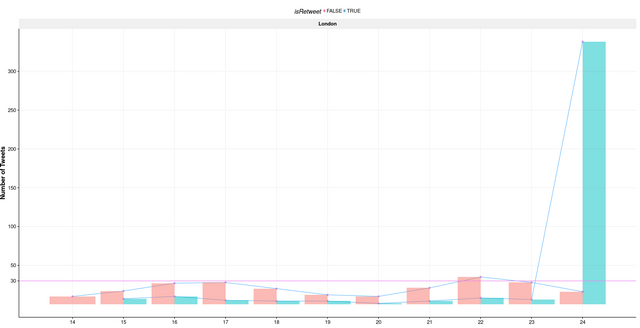
There are only a few tweets daily from each of the cities I looked at, with the exception of London. London Displays some interesting features, so lets look at that in more detail. The following graph shows the number of tweets per day in London, with the colours differentiating between tweets and retweets.
blue bar is count of retweets
red bar is count of tweets

- On the 24th of January there was a huge spike to 348 tweets, up from a daily average of about 30. As can be seen in this graphic most of the activity is related to retweets.
So what was all the activity about?
Wordcloud of Tweet Text
Wordclouds are a useful tool to bring out text data and give an insight into what has been said in a body of text. So lets look at London tweets on 24th of January

- @vaniccilondon was the person doing all the retweeting on this day and the words give a fairly good indication of what was discussed in the tweets.
Sentiment of Tweets
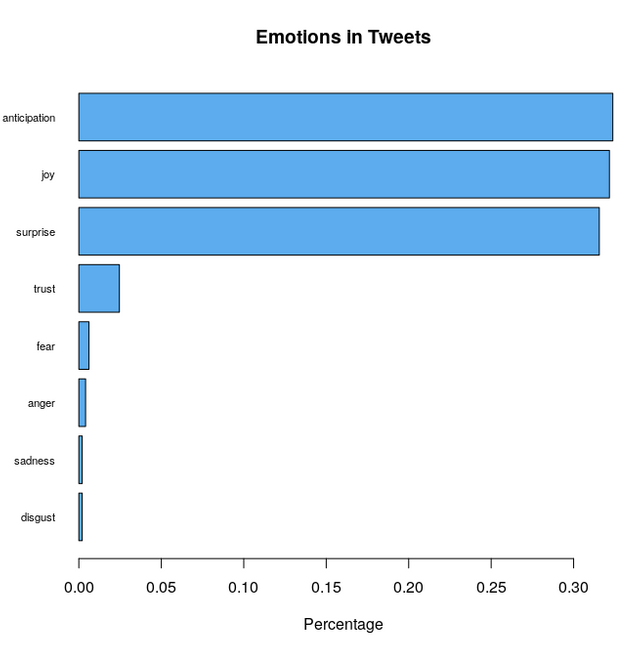
The last ML technique which I can run on this data today is some basic sentiment analysis. What sort of sentiments were in the tweets from London on 24th of January.

- This pacakge I am using for sentiment works well on English language but I wont be able to roll this analysis out easily to other languages.
Discussion
This activity report for Twitter will take a while to roll out globally but it would also be interesting to look at how other social networks are mentioning Steem/it and how this activity is changing on a weekly basis.
What metrics from this post did you find most useful?

Related Posts
I am taking a deep dive into the Accounts and Activity of Users in this series of posts. I will be producing regular reports based on the outcome of this series. You may also be interest in:
- https://steemit.com/stats/@eroche/steem-post-payouts-and-steem-health-part-2
- https://steemit.com/stats/@eroche/steem-post-payouts-and-steem-health
- https://steemit.com/stats/@eroche/steem-comment-data-and-automated-accounts
- https://steemit.com/stats/@eroche/steem-post-data-and-automated-accounts
- https://steemit.com/stats/@eroche/steem-network-growth
- https://steemit.com/stats/@eroche/steem-distribution-of-posting-rewards-by-account
- https://steemit.com/stats/@eroche/steem-distribution-of-posts-by-account
- https://steemit.com/stats/@eroche/steem-account-activity
- https://steemit.com/stats/@eroche/steem-geographical-distribution-of-accounts
Thank you for reading this. I write on Steemit about Blockchain, Cryptocurrency, Travel and lots of random topics.

A lovely analysis and explanation. Good colorful charts. So easy to grasp, loved the fluency and to the point script. Thank you @eroche for highlighting unique stuff as usual.
Useful addition to data analysis on steem.
Does the 30 tweets daily average = (all tweets + retweets) and is that from all UK twitter accounts?
Personally I'd like to see daily average tweets as the headline in the analysis then the geography (love that btw - basically a map of UK cities!) then the rest.
If it's 30 a day that's low: how many steem tweets would I need to make in a day to top the leaderboard?
Cheers. Love these analysis posts be interesting to get comparative data over time - although binning my month will be much more informative in the long run.
The 30 day average does include all tweets and retweets from that location. Twitter data can be searched by location so I have searched by the major cities within a 25 mile radius. I think this works quite well at capturing most of the tweets in a region, I will obviously be missing some.
I agree daily averages would be a better headline then totals for the map as the next part of the analysis.
30 a day seems very low, I searched US cities and there is much more coming from those. I may extend the search radius there before posting these as the cities are more spread out but there is significantly more twitter activity coming from the States.
Thanks again, great analysis.
I'm tempted to game twitter in the coming week to get a free mention! Now I'm on my laptop (rather than phone) I can see that all I need is 10 measly tweets to be the 'top tweeter'! (assuming all other things remain equal).
It's interesting that it's so low for the UK compared to the US, but you'd have to do any comparison on a per-steemit user-per-country basis for it to be meaningful.
Definitely extend that search radius for the States, I think: there are SO MANY problems with getting the metrics right aren't there! As long as yr clear about what methods yr using it's all good though, great analysis.
As I've said before, it's useful to actually have data ( however you 'filter' it) rather than just speculating about the growth of the platform based on intuition.
Karl.
The top tweeters I have shown here are ordered by number of followers so some people are tweeting much more but they are way down the list with respect to followers.
I was looking for the twitter accounts that have the most exposure that are tweeting about Steemit. How many twitter followers do you have by the way?
I really appreciate the input. I am going to put this stuff into regular reports, the key will be to monitor over time how these are trending but I wanted to start with some exploratory analysis as to what works, whats misleading, whats possible before producing regular reports.
I have a measly 2.8K or something like that, so I might not feature!
Incidentally Facebook drives 2* as many people to my WP blog compared to twitter and I have much less of a following on Facebook (I don't really like FB) - as in 10* less.
Twitter gives me about 500 hits/ month, FB 1000 and the other 398 550 come mostly from google searches, so although I love Twitter (it's just my thing - there's more intellectuals there) if steemit's anything like WP yr starting with the low hanging fruit!
I can't do a comparative ananlysis of what drives traffic to my steemit blog as I've no way to access the data (I don't think).
This is really good to know, it will definately be interesting to get some stats on Facebook traffic. I might have to sign up to use the API though 😒
I don't think the data is available for traffic on your steemit blog, not through steemit.com at least. Are there any plugins for WordPress you could use to display your steemit posts on your blog. You could direct traffic there to get your analytics.
I've decided FB is worth using even though I don't like it! On the WP it's .com so I can't get that many useful plugins. Shouldve gone .org
When I saw it was based on tweets I got all excited to see if I was in there and boom! I am :0) great stuff. I love this info
Boom!
thanks for the deep explanation of how steemit is attracting the attention of many tweeters, my country venezuela steemit is the best source of work that excites, Venezuelans earn more money in steemit than in their own work.
Good to hear that. Good luck for all your brothers and sisters. What do you think about the ccrypto Petro? Will it be useful for your people?
the president of venezuela launched the crypto currency "petro" is for the economic blockade that is making it united to venezuela, at times the idea is well seen as the petro will go to market with the price of a barrel of Venezuelan oil that would be $ 60 for "petro".
Of being useful the petro for the Venezuelan, clear that if since we can change our bitcoin to petro and buy edible ect.
Thanks for your respond @joelgonz1982. Have a good day!
equally @johano
I have Twitter but only use it if it sends me an interesting 'in case you missed it' message. It's a case of priorities. Twitter ranks low for me and Steemit ranks high.
I rarely tweet too but it's good to see the word on Steemit being spread on other social media. I would love to do this analysis for Facebook and Reddit too.
That would be a big job. Well done if you take it on! Very interesting posts you create.
Thank you.
Big thank u
Because steam stock is related to the market, people's thinking is more about its index.
Excellent post , thanks for sharing
Good news for steemit. I like the graph of Emotions in Tweets. This shows the bright side of humanity.
You seem to love stats. Do you have an idea where I can find out, what languages are use on this platform and percentage?
I haven't seen a recent analysis of this. This report from last year gives an indication of the top languages excluding English at the time
https://steemit.com/language/@arcange/how-multilingual-is-steemit
I think that Stimet Inc. should come up with a new scale to distribute the bonus pool more evenly, still a large proportion of bonus pool distribution concentrated in the accounts of a few authors. I am two people, I have missed the rest of the social networks