Steemit Crypto Academy Season 3 Week 2 - Beginner's Course | Introduction to Charts
It is with great pleasure that I welcome everyone to the second week of the third season of the Steemit Crypto Academy. I'm @reminiscence01, one of the newly appointed professors for the beginner's category, and I wish to extend my gratitude to everyone and also invite you on this journey, as we explore the crypto world through research and collaborative study.
Starting with the proper foot, I will be introducing charts, their components, and how to identify them. This might be new to some people in this category and of course, nothing new to others.
What is a chart?
Accumulation of information over time requires a systematic way to display the information for easy comprehension and readability.
A chart can be explained to be the use of various things like symbols, lines, graphs, images, pictures, objects arranged in a defined order to represent and convey actual information about the subject of interest.
In finance trading, a chart is used to display the movement of the price of a commodity over a period of time, and based on this premise, technical analysis was developed.
There are many types of price movement charts in finance trading developed from different ideas of how price should be represented, but they all show the movement of price in a specified direction and time. Some of these include Candlestick charts, Line charts, bar charts, volume charts, tick charts, Renko charts, etc. All the above-listed charts do one thing, and that is showing the direction of price within a specified time. The most used chart is the Japanese Candlestick chart.
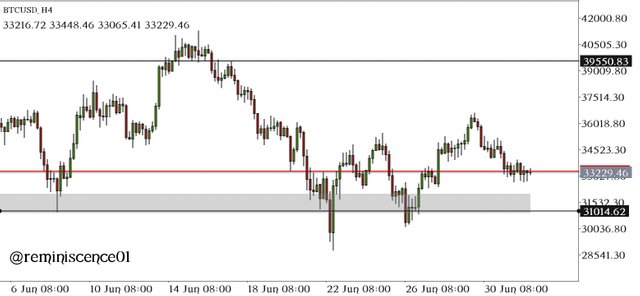
A candlestick chart is a form of representation of the price of an asset indicated by candlesticks arranged following the actual movement of the price of an asset in a specified time. The overall view of the candlestick chart conveys meaning to traders, showing significant price points recorded and hinting at the future movement of price. The use of candlestick charts to determine the future price of an asset is referred to as Technical Analysis.
The candlestick chart is very useful in cryptocurrency trading, it reveals the sentiment of the market indicating which side is in control within a period, either buyer or sellers. Candlestick charts can be used by itself to determine the movement of price, but it is often used with other technical tools to determine the future movement of price, thus aiding in the better trading decision.

The Japanese Candlestick
The Japanese candlestick is an ancient system developed in Japan in the 1700s by a Rice trader Munehisa Homma, characterized by his understanding of supply and demand was determined to study the price rotation and how the market reacts to it, which he succeeded and developed the foundation candlestick.
The Japanese candlestick or Candlestick is widely used because of how it represents price movement. Candlestick tries to graphically illustrate the interaction between buyers and sellers in the market, showing various price points during the interaction. Typically, a candlestick is made of four parts: open, high, close, and low, each representing a specific point in price movement.
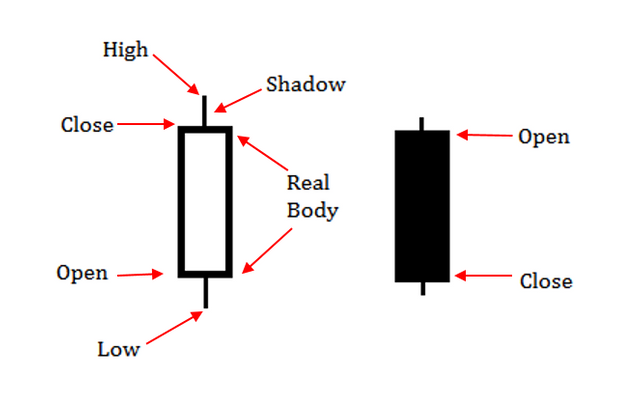
Image Source
Dissecting a candlestick (Candlestick Anatomy)
As previously explained, the Japanese candlestick represents price movement with its four-part. We will be discussing those parts:
- Open (Opening price) -This indicates the start of price movement. The price is marked and built upon as the movement of price is recorded within a specified time.
- High (Highest price) -This part of the candlestick indicates the highest price recorded within a specified time.
- Low (Lowest price) -This part of the candlestick shows the lowest price recorded within a specified time.
- Close (closing price) -This part of the candle indicates the last price recorded in a candle. It marks the end of the candle within a specified time.
The other parts of the candlestick are the shadow and real body, the shadow illustrates the unsettled movement of price, areas that price moved through but couldn't close. In other words, the struggle between buyers and sellers.
The real body of a candle indicates the distance covered by price within a specified period. It is the space between the opening price and closing price, this also indicates the momentum of the candlestick. The bodies of a candlestick are often associated with color for easy identification. Traders can choose how to set up their charts with colors and tools based on their specifications and trading systems.

Candlestick Analysis
It is ideal to understand that the price of an asset or commodity can only move in one of two ways, either up or down. In finance trading, this concept has many names to attribute it with, they include:
| Up movement | Down movement |
|---|---|
| Buy | Sell |
| Long | Short |
| Bullish | Bearish |
| Bulls | Bears |
The Japanese candlestick is classified based on this movement. Each candlestick body is filled with a color showing the side of the controlled participants.
Conventionally, the upside move candles are called Bullish candles and the downside move candles are called Bearish candle.
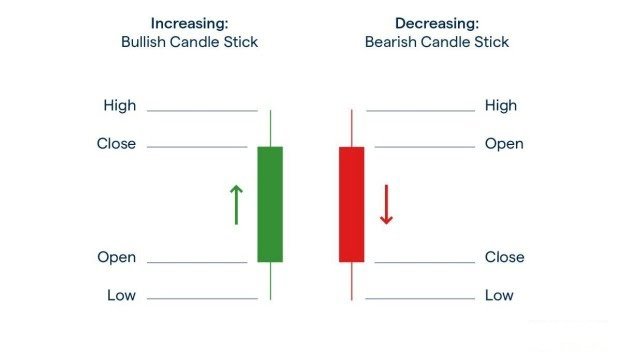
Image Source
Bullish Candlestick
A bullish candlestick is a form of price representation that shows an increase in the price of an asset or commodity. It is characterized by the closing price settling and closing above the opening price, this indicates that the price moved upward within a specified period.

Image Source
Explaining the above image, the opening price is below the close price indicating an increase in the price of the asset represented. The low shows the lowest price recorded within the candle, similarly the high shows the highest price recorded within the candle.
In finance trading, continuous formation of this type of candlestick represents a continuous increase in the price of an asset, it is known as Bullish Trend.
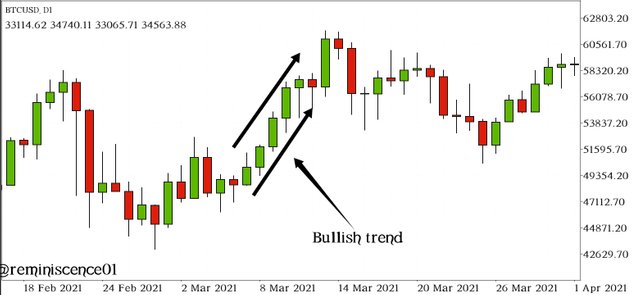
Bearish Candlestick
A Bearish candlestick is a form of price representation that indicates a decrease or decline in the price of an asset or commodity. It is characterized by the closing price settling and closing below the opening price. This indicates a downward move of price and a decline in the value of an asset within a period of time.

Image Source
In the above image, the closing price is below the opening price indicating a decrease in the price of the asset represented. Similarly, the low shows the lowest price recorded within the candle, the high shows the highest price recorded within the candle.
The continued sequence of this type of candlestick represents a continued decrease in the price of the asset. This phenomenon is known as the formation of a Bearish Trend.
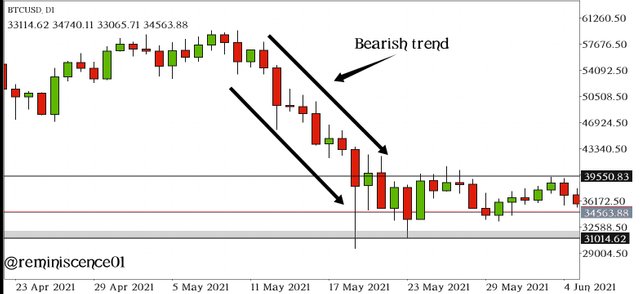
In our next lesson, we will be discussing various Candlestick Patterns and their interpretation to predict the direction of the market.
Conclusion
As understood in the lesson, charts are an integral part of trading that presents the relationship between buyers and sellers in graphical forms. The Japanese candlestick chart is widely used to show the various price point important to traders to capitalize on the opportunities presented by the market.
A good understanding of the charts will definitely improve one's trading as it offers quality information about the markets.
Homework Tasks
- Explain the Japanese Candlestick Chart? (Chart screenshot required)
- Describe any other two types of charts? (Screenshot required)
- In your own words, explain why the Japanese Candlestick chart is mostly used by traders.
- Describe a bullish candle and a bearish candle identifying its anatomy? (Screenshot is required)
Homework Guidelines
- Homework must be posted into the Steemit Crypto Academy community.
- Plagiarism is a great offense in Steemit Crypto Academy and it won’t be tolerated. Ensure you refrain from any form of plagiarism.
- Your post should not contain less than 300 words.
- All images, graphs, and screenshots from external sources should be fully referenced, and ensure to use watermark with your username on your own screenshots.
- Use the tag #reminiscence01-S3week2 #cryptoacademy and your country tag among the first five tags. Also include other relevant tags like #Charts #Candlesticks.
- Homework task run from Sunday 00:00 July 4th to Saturday 11:59 pm July 10th UTC Time.
- Only users with a minimum of 125 SP and having reputation above 50 are eligible to perform this homework task. Also, note that you must not be powering down.
The comment section is freely opened for suggestions and feedback on the lesson and homework task.
Here is my home work post
https://steemit.com/hive-108451/@chimezunem001/steemitcryptoacademy-or-season-3-week-2-beginner-course-by-reminiscence01-introduction-to-chart
Good job professor @reminiscence01. Concepts clearly explained. I shall hit your office with my work soon.
Thank you. I look forward to your homework task.
My homework post professor https://steemit.com/hive-108451/@daiky69/crypto-academy-season-3-week-2-homework-post-for-reminiscence01-or-or-beginner-s-course-introduction-to-charts-or-or-by-daiky69
My entry
https://steemit.com/hive-108451/@doctor23/crypto-academy-season-3-week-2-homework-post-for-professor-reminiscence01
Thank you professor for taking us through this wonderful lectures. In fact, I'm eager to take part in this homework
Thank you. I hope to see your homework task soon.
Here is my entry
https://steemit.com/hive-108451/@predomina/crypto-academy-season-3-week-2-homework-post-for-professor-reminiscence01
Twitter Promotion
Hi teacher, this is my task
https://steemit.com/hive-108451/@bealau19/steemit-crypto-academy-season-3-week-2-beginner-s-course-or-introduction-to-charts
Esta fue una lectura asombrosa y fácil de comprender. Estaré encantado de participar
am I eligible for this homework? REP-54, SP-166, but I have not completed all 4 levels of the newcomer community.
Yes, you are eligible to participate.