Introduction
My fellow steemians,
It's a pleasure on my side to be in attendance in this wonderful lecture which was presented by our very own able professor in the person of
@reminiscence01 on the topic "
Introduction to Charts ". Sincerely, this lecture has really brighten my knowledge and understanding as regards the topic under review. After attending the lecture which was well delivered by the professor him self, I have resolve to attempt the assignment task. I will be answering this questions based on my knowledge from the lecture and the little research I was able to carry out. Read through and make corrections and contributions where necessary.
Question 1
EXPLAIN THE JAPANESE CANDLESTICK CHART (CHART SCREENSHOT REQUIRED)
Before I go into explaining what Japanese candle chart is all about, let me first and foremost enlighten us briefly on what a chart is. Now let's get started.
What is a chart
A Chart is a pictorial representation of information. This information are mostly represented through lines. Now if you have a large number of data, sometimes it is normally difficult to explain this information in a simple term hence the only to make it clear and easy to understand is by grouping and representing it on a chart. This chart actually shows the flow of the information.
With that little idea in mind, what then is crypto chart? Crypto chart is a form of a chart that enable traders as well as investors in the crypto world to understand the price movement of an asset at any point in time. This chart enable the traders to know exactly when to buy or sell an asset. I will be explaining further on how the crypto chart is use by traders as we progress.
JAPANESE CANDLESTICK CHART
.jpeg)
Source
In as much as crypto trading is concerned, one of the most widely used chart is the Japanese candlestick chart. This is a crypto chart that is used by investors as well as traders to ascertain at the glance of the chart they exact price movement of an asset. The method was use by the Japanese rice merchants in analysing the price of their commodity. It actually an important tool because evaluations carried out by this tool seems to be very accurate so the method was adopted by the said merchants.
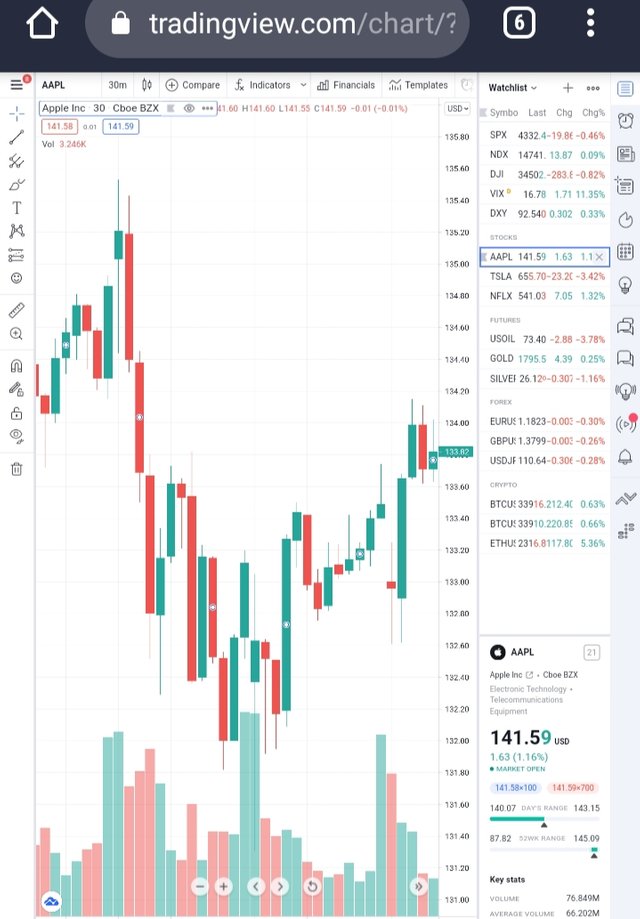
From the screenshot above the candlestick will clearly show it's features which include the opening prices, closing prices etc. The candlestick is also use to show both the bearish and bullish trend of the crypto currency under review.
REPRESENTATION UNDER JAPANESE CANDLESTICK CHART
Source
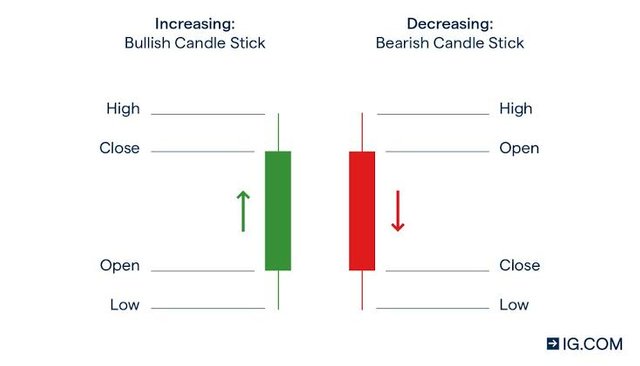
The picture above shows some of the features that explains how a candlestick is represented.
Green Bar:
When we talk about the bullishness of a crypto coins, it is mostly represented using this colour of the candlstick. This shows the uptrend movement of the coins. Note also that the top here indicate close whereas the down indicate a open.
Red Bar:
When we talk about the bearishness of crypto coins, it is mostly represented using this colour of the candlestick. This shows the downtrend movement of the coins. Note also that the top here indicates open whereas the down indicates a close.
COMPONENT OF CANDLESTICK
The components of the candlestick as shown in the image above has two major part and this include the body and the shadow. And this candlestick has the following characteristics as well.
- High
- Low
- Open
- Close
- Shadow
- Real body
This various characteristic are explained briefly on the table below.
| S/No. | Component | Feature |
|---|
| 01. | High | This is the highest price or the highest level of a particular crypto currency at a given point in time. |
| 02. | Low | This is the downfall of the price of a particular crypto currency |
| 03. | Open | This is the start up of the price of a particular crypto currency at any point in time. |
| 04. | Close | This is the closing point of a particular crypto currency at any point in time |
| 05. | Shadow | The shadow shows the price rate of the day or of a particular time of the crypto currency and it can either be low or high price as the case maybe |
| 06. | Real body | This covers the entire details of the candlestick ranging from the opening, close, low and high of the crypto currency at a particular point in time |
To further explain this chart in a more suitable way, it has then been group into three different patterns of presentation and this are Single Pattern, Double Pattern and the Triple pattern. I will be explaining this patterns briefly below.
SINGLE PATTERN
In this pattern of trading, the chart focuses on only one period or time of trade. It is the easiest pattern among the others. This pattern has the following Spining top, Hammer, Shooting star.
DOUBLE PATTERN
In this pattern of trading, the chart focuses on two way period formed from the market signal. This pattern has the following Harami, Tweezers, Homing pigeon.
TRIPLE PATTERN
In this pattern of trading, the chart focuses on three way period or time of trade. This is the strongest pattern because of the number of signal it forms. The pattern has the following Morning star, Three white soldiers, Evening star.
Question 2
DESCRIBE ANY OTHER TWO TYPES OF CHARTS?
There are many other charts available for market price analysis but for the sake of this studies I will be looking at Bar chart and Line chart. Let's get started.
LINE CHART
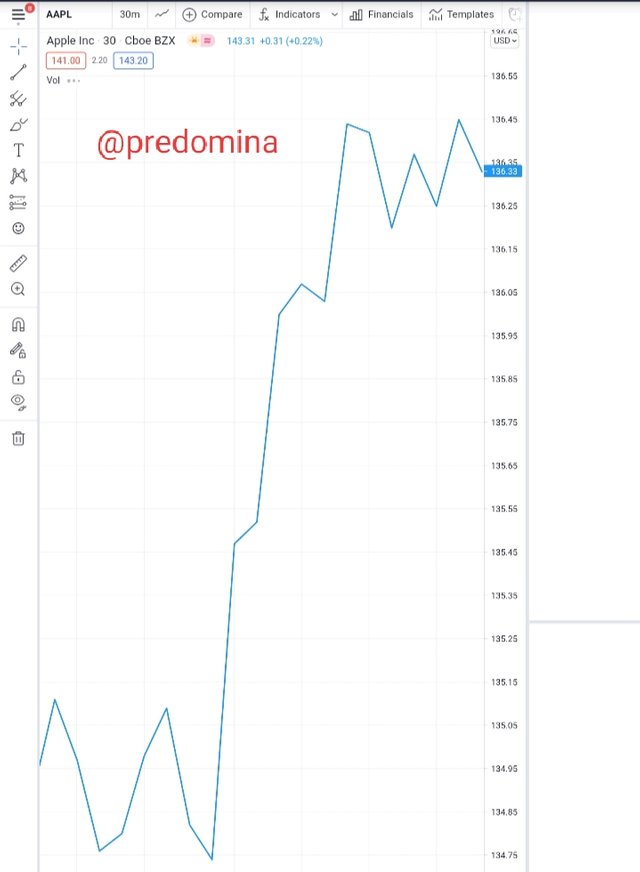
One of the most easiest chart to understand is the line chart. The reason why it is so easy to understand is based on the fact that a whole lots of information as regarding the trade is not provided hence it gives u a clear view by just glancing at it. The image above shows a line chart.
BAR CHART
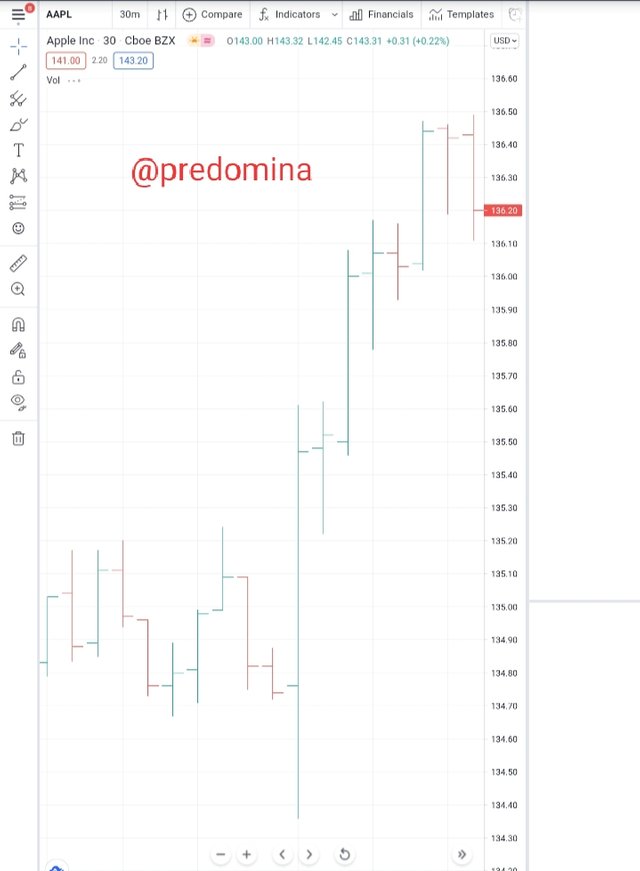
Unlike the line chart where a lot of information are hidden, in this chart more detail information are provided and hence it helps you as a trader to have a better analysis of the coins under review. It's a bit more complicated to understand when compared to the line chart. The image of this chart is seen above.
Question 3
IN YOUR OWN WORDS, EXPLAIN WHY THE JAPANESE CANDLESTICK CHART IS MOSTLY USED BY TRADERS
The reasons why traders use the Japanese candlestick to trade can not be overemphasized, this is because this tool in question has proven to be the best when it comes to technical analysis. The tool is so self explanatory because if you understand the concept of (OHLC) which stands for open, high, low and close, you can be able to ascertain the movement of the price of a coins at a glance of the chart. If the chart is understood by it's users, the trader will be able to note when to enter and also exit a particular trader for profit or loss respectively. More also, when this tool was use by the Japanese merchant it gave a very good result. And it has been so efficient when use in the crypto world.
Question 4
DESCRIBE A BULLISH CANDLE AND A BEARISH CANDLE IDENTIFYING ITS ANATOMY
BULLISH CANDLE / TRENDS ANATOMY
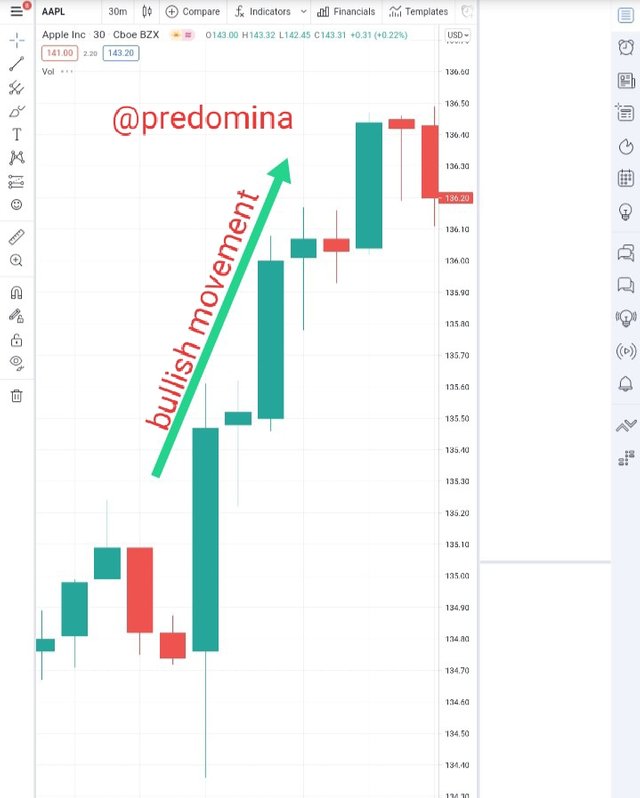
When we talk about bullish candle it means when the price of the coins under review moves upward or we can say when there is an uptrend movement of price of a coin. Using the Japanese chart, it is usually represented by the red colour by default.The image above shows a continuous movement of the coins.
BEARISH CANDLE/ TRENDS ANATOMY
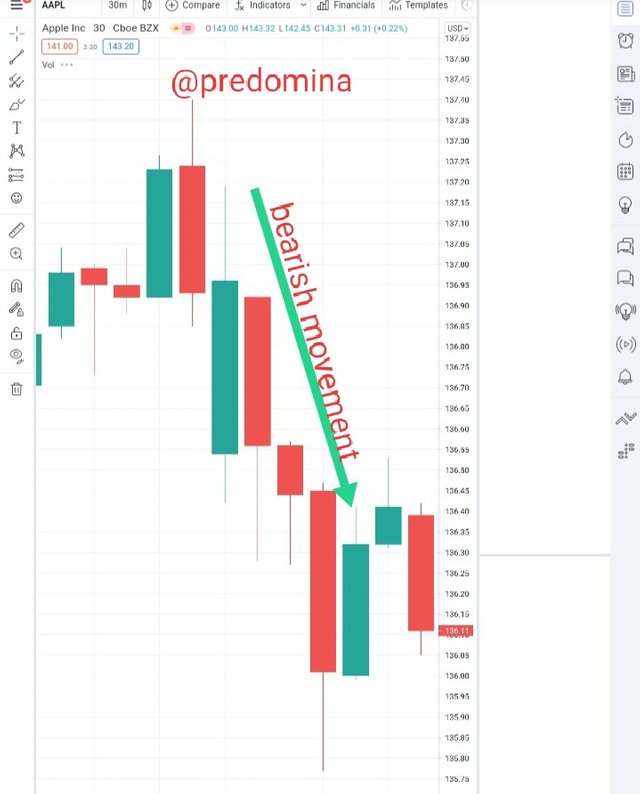
When we talk about bearish candle it means when the price of the coins under review moves downward or we can say when there is a downtrend movement of the price of a coin. Using the Japanese chart, it is usually represented by the red colour by default. The image above shows a continuous downtrend movement of the coins.
Source
SUMMARY UNDER IT'S ANATOMY
The table below shows the summary of the anatomy of bullish and bearish which include high, low, close and open.
| S/No. | Parts | Features |
|---|
| 01. | High | This is the highest price that the coin is sold at a particular point in time |
| 02. | Close | This is the closing rate of an asset at any particular point in time |
| 03. | Open | This is the startup price of a particular coin at any point in time |
| 04. | Low | This is the lowest price of an asset at any given point in time |
CONCLUSION
In conclusion, the lecture has really broaden my understand on how to study the various components of the Japanese candlestick. I have also learnt how the candlestick started. I want to sincerely appreciate the professor
@reminiscence01 for such a wonderful lecture. I await the next lecture as it had really been a great pleasure learning from you sir.
Hello @predomina, I’m glad you participated in the 2nd week of the Beginner’s class at the Steemit Crypto Academy. Your grades in this task are as follows:
Observations:
The question didn't say bullish trend, rather explain bullish candle.
A bullish candle is a candle whose closing price is above the opening price.
Recommendation / Feedback:
I expected you to be more technical in your explanation. Thank you for participating in this homework task.
Thanks prof.