Steemit Crypto Academy Season 3 Week 2 - Beginner's Course | Introduction to Charts
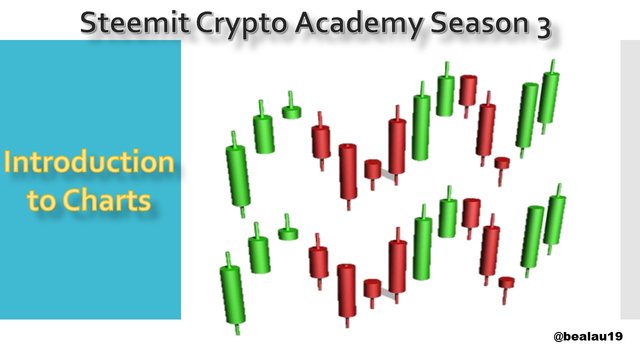
Image created by me in Power Point
Hello my friends from the crypto-academy. Excellent week for everyone and good vibes. Greetings, my name is Laura and I am from Venezuela, it is an honor for me to carry out this assignment since we must all be clear about what the graphics we are working with are and what the candles mean or what they want to tell us. Thanks to teacher @ reminiscence01 for this great lecture and for the following assignment:
•Explain the Japanese candlestick chart. (A screenshot of the graph is required)
•Describe two other types of charts. (Screenshot required)
•In your own words, explain why traders primarily use the Japanese candlestick chart.
•¿Describe a bullish candle and a bearish candle identifying their anatomy? (Screenshot required)
Without further ado we start
---
Explain the Japanese candlestick chart. (A screenshot of the graph is required)
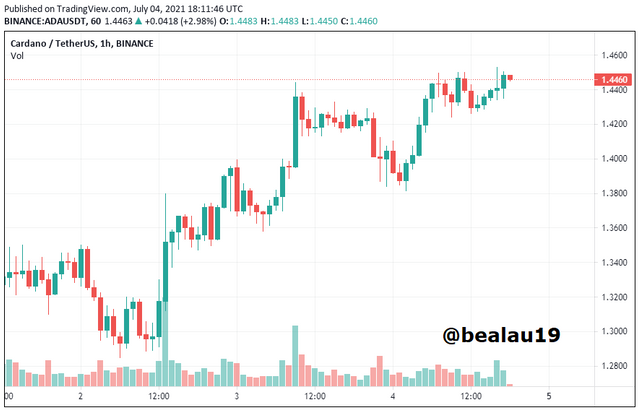
Here we can see the Japanese candlestick chart that shows us the evolution of the price in a certain period of time in this case we are looking at Cardano where each candle represents 1 hour. And we see that from one hour to another the prices vary considerably with an upward trend and also the candles provide us with fundamental information.
In this case, the candle is made up of a body where the base would be the opening price. Also in the candles we find the needles that are located up and down that indicate the minimum and the maximum, that is, the amplitude of the needles shows us the width of that price range where the stock moved during that hour. In addition, to further facilitate the analysis, each candle has its color in this case green that represents the price that has increased during that hour, this would be the bullish Japanese candle. And we have the red candle and it represents the price of the stock when its price falls and there are many sales in the market, that is, the downtrend.
---
Describe two other types of charts. (Screenshot required)
First of all we have:
The line chart
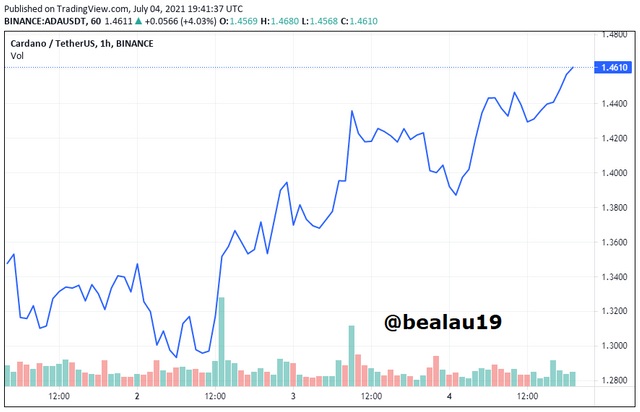
It consists of a single line that is drawn by joining the closing prices of each day or period.
In this example we are seeing how the hourly movement of Cardano has been from July 1 to July 4. It is the simplest of the charts but it could also be said that it is the most incomplete, as it only shows us the closing prices it does not allow us to know what happened during that hour or that period.
And finally we have:
The bar chart
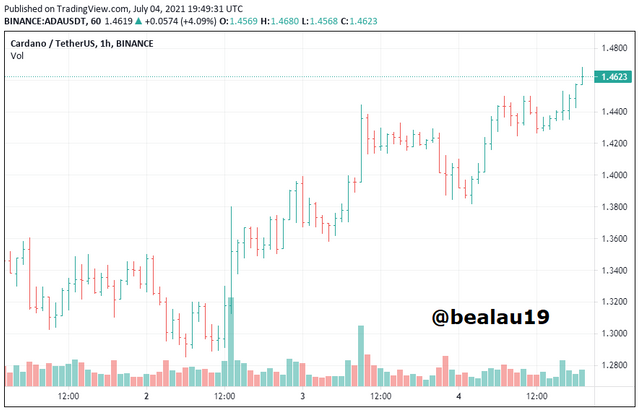
It is a little more complex than the previous one but it has the advantage that if it shows us the 4 values that we must know. As before we continue to see Cardano from July 1 to July 4. This time we can see that the graph is made up of several bars like the one we see in the capture.
Each of these bars represents a 1 hour period in the market. The line to the left represents the opening price, the lowest part of the bar represents the minimum price, the highest part represents the maximum price, and the line to the right represents the closing price. The line on the left will always be the opening price and the line on the right will always be the closing price, whether it is an uptrend or a downtrend.
This type of graph is very complete in the information we need but it can be confusing or difficult to read at times.
---
In your own words, explain why traders primarily use the Japanese candlestick chart.
The Japanese candlestick system has changed the way of interpreting charts in investments.
The Japanese candlestick chart originated in Japan in the 18th century. Basically it presents us with the same information as the bar graph but in a much more user-friendly way to read. And this graph is then definitely the one preferred by the vast majority of traders since it has the best of the line graph and the bar graph, it is easy to understand but at the same time it is complete in the information it provides.
Japanese candlestick charts are one of the most fundamental tools for any trader or investor and knowing how to read these types of charts is essential to be successful. Not only do they provide a visual representation of the price action for a given asset, they also offer the flexibility to analyze data at different time periods.
Candlestick charts are found by many traders to be more difficult to read than line and bar charts even though they provide similar information.
---
¿Describe a bullish candle and a bearish candle identifying their anatomy? (Screenshot required)
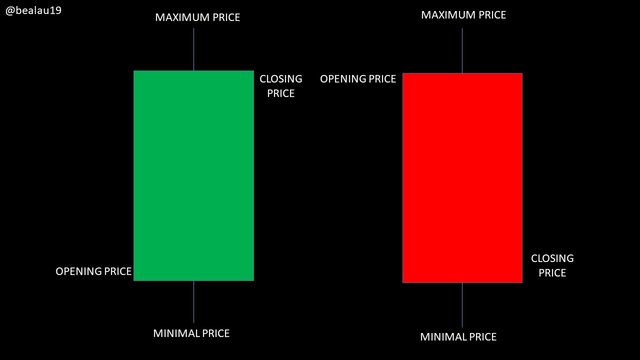
Imagen creada por mi en Power Point
Anatomy of Japanese candles
A candle is made up of 4 important parts:
-Opening price: The first record of the asset's trading price during the time interval in question.
-The maximum price: The highest trading price of the asset that has been recorded during the time interval in question.
-The minimum price: The lowest trading price of the asset that has been recorded during the interval.
-Closing price: It is the last trading price of the asset registered during the requested time interval.
The relationship between the opening price, the maximum price, the minimum price and the closing price determines what the candle will look like. And the distance between the opening and the close is known as the “body”, while the distance between the opening and the maximum price is known as the “wick” or also “shadow”. The distance between the minimum price and the maximum price is often called the “candle range”.
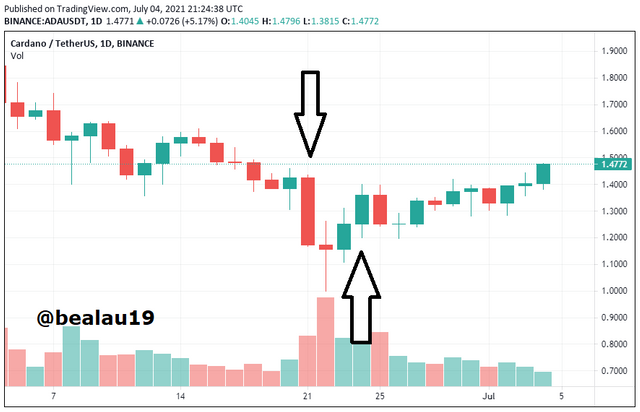
And as we can see in the screenshot, the arrows indicate the bullish or positive candle and the bearish or negative candle.
The green candle analysis is where there was the most buy volume, and the red candle analysis is where there was the most sell volume.
---
Conclusion
All of these charts show information about the price of the stock over time. But for our purpose from my point of view is that of Japanese candles. And thanks to this task we can say that we already know how to read a Japanese candlestick chart, identify what the price did in the past, which is very different from knowing how to interpret it and trying to foresee what will happen in the future but little by little we learn. I hope my task has been of great help since there are many beginners who do not know how a graph is structured.
¡THANKS FOR READING ME!
CC:
@reminiscence01
