Crypto Academy // Season 3 / /Week 2 - Homework Post for Professor @reminiscence01
QUESTION 1
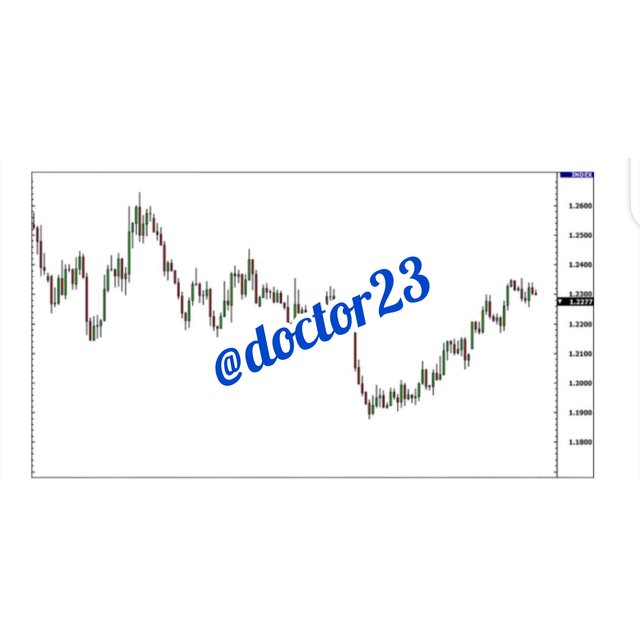
Explain the Japanese candlestick chart(chart screen-shot required)
The Japanese candlestick.
I will begin by giving a brief historical background on the Japanese candle stick. It is said that the Japanese candlestick was produced in Japan; reason for naming it the Japanese candlestick. It was meant to predict future prices by the legendary Munehisa Homma who was a rice trader.
The western era was known to use the bar chart, as the Japanese candlestick evolved, so many traders began seeing the need of engaging in the Japanese candlestick.
The candlestick chart pattern represents the range of the various session’s opening and closing price.
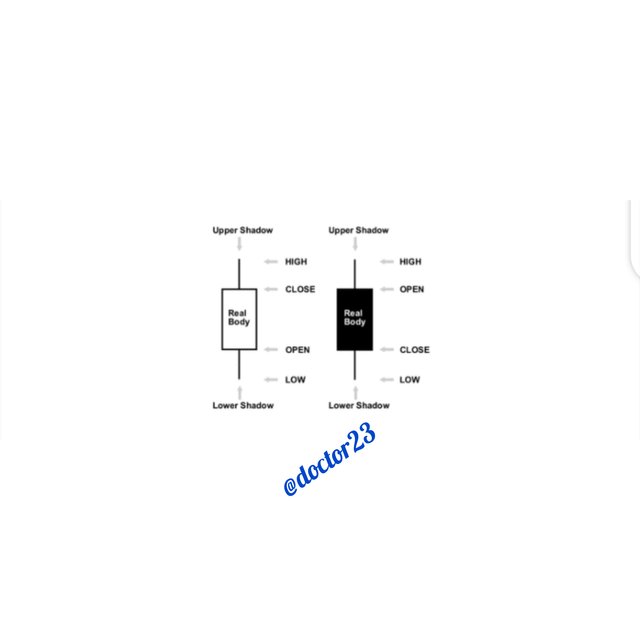
Now explaining the various features of the Japanese candlestick, I will be using the black and the white candlesticks; although we can always customise the colours in the various trading platform according to our taste.
I will be using;
- The White candlestick to represent a bearish trend
- The Black candlestick to represent
From the screen-shot above, the candlestick represents the high to low range with the vertical line.
The top represent the opening price and the bottom represent the closing price for the black candlestick.
The bottom represent the closing price and the bottom represent the opening price for the white candle stick.
The body or the middle big part indicates the range between the opening price and the closing price.
QUESTION 2
Explain any other two types of charts? (screen-shot required)
Types of Charts
A) The line Chart
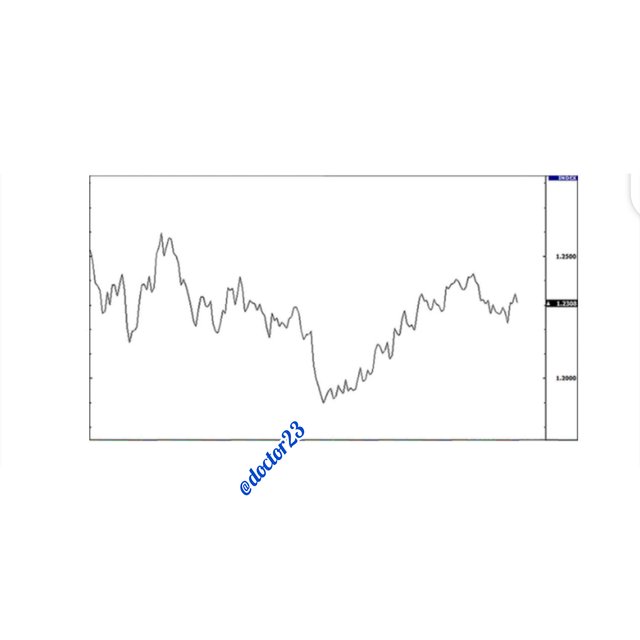
The line chart is very Basic, it draws a line from one closing price to the next closing price. In the line chart, we just see a general price movement over a time, and no particular open or close at a defined time.
B) The Bar Chart
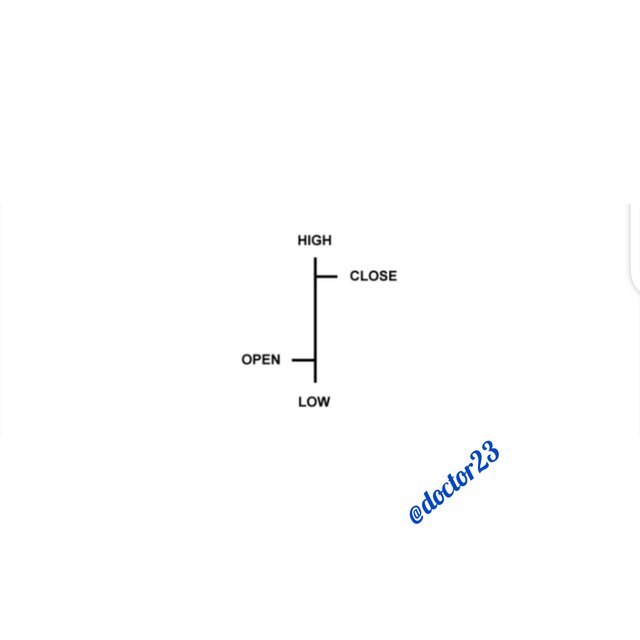
The bar chart is more advanced than the line chart. It has an open a close, a high and a low. The bottom of the bar chart shows the lowest price traded for that particular time period and the top shows the highest price traded for that particular time period.
The bar chart has the following characteristics;
- The vertical bar indicates the currency pair trading range
- The Open price is represented by the horizontal line on the left.
- The closing price is represented by the horizontal line on the right.
- The top of the vertical line shows the highest price of the period
- The Bottom shows the lowest price of the period.
QUESTION 3
In your own words, explain why the Japanese candlestick chart is mostly used by traders.
Why the Japanese candlestick is useful for most traders
The Japanese candlestick is used by traders for the following reasons;
- the Japanese candlestick are easy to interpret.
- it is much easier for beginner to understand the Japanese candlesticks.
- since visual is more helpful in studying, traders often use the japanese candlestick because of the adaptability in visuals.
- it is easy to identify market turning points when using the candlestick chart pattern which is also a reason why traders engage in the Japanese candlestick.
- with the names that have been given to the different types of candlesticks formed such as as the morning star, the evening star, the shooting star, the doji, and others, it is easier for traders to memorise this easily.
- most books in the cryptocurrency trading are always written using the Japanese candlestick which is also why engage in the Japanese candlestick.
QUESTION 4
Describe a bullish candle and a bearish candle identifying its anatomy? (screen-shot is required)
The Bullish and Bearish Candlesticks
1) The Bullish Candlestick
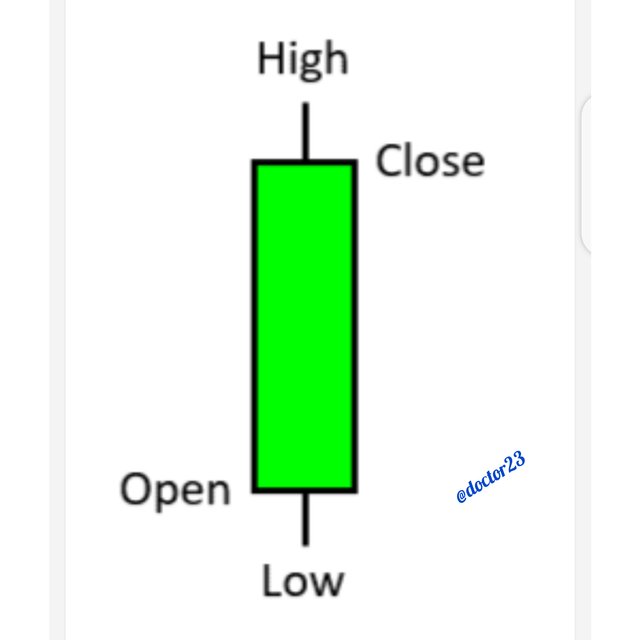
The bullish candlestick is represented when the close is higher than the open. With the bullish candlestick, it indicates that the market is dominated by buyers than sellers; in other words, there is more demand than supply.
The bullish candlestick is composed of the high, the low, the open, the close, the body.
- the bullish is candlestick is often represented by green or white, although it can be customised.
- the opening price is usually lower.
- may consist of lower and upper shadow
- the closing price is higher
- all the time frame uses the same formula in its calculation.
2) The Bearish Candlestick
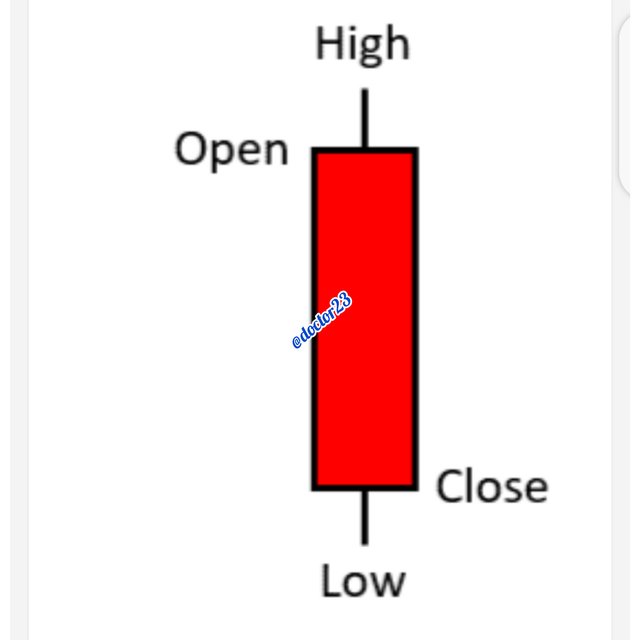
The bearish candlestick is represented when the close is lower than the open. Just like the bullish candlestick, it is the complete opposite of the bullish candlestick. The bearish candlestick is formed when sellers are dominating the market. In this case, it means supply exceeds demand forming a bearish candlestick.
The bearish candlestick just as the bullish candlestick as well is composed of the open, the close, the high, the low, and the body.
- The bearish candlestick is represented by a black or red colour, though it can be customised as well.
- the opening price is usually higher.
- the closing price is lower.
- it is represented same, with the same formula in the various time-frames.
- might have a lower and upper shadow
Conclusion
With the evolution of the Japanese candlestick, I can say it has really been helpful to traders, and for me in particular, with the various ease with which it is coupled with, not forgetting how it can easily be used alongside other indicators to analyse the marker with more and higher probability.
Cc; @reminiscence01
Hello @doctor23 , I’m glad you participated in the 2nd week of the Beginner’s class at the Steemit Crypto Academy. Your grades in this task are as follows:
Recommendation / Feedback:
You did great a work on Japanese candlestick chart. Thank you for participating in this homework task.
Thank you @reminiscence01, but the overall calculation is 8/10..
Surely you mistaken it.