Steemitcryptoacademy | season 3 week 2 beginner course by reminiscence01 introduction to chart
Week: week 2, season 3
Professor : @reminiscence01
course : cryptoacademy
topic : introduction to chart
Hello steemian am writing in response to to the assignment given by the professor which he taught about introduction to chart I have attended the class and below is my home work task, thanks for reading through.
Explain the Japanese Candlestick Chart? (Chart screenshot required)
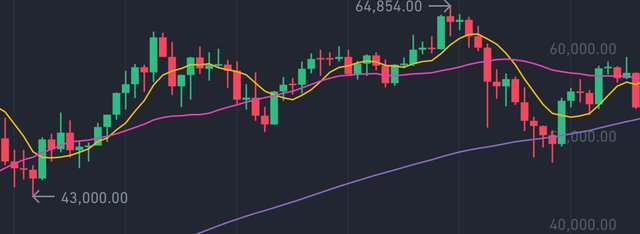
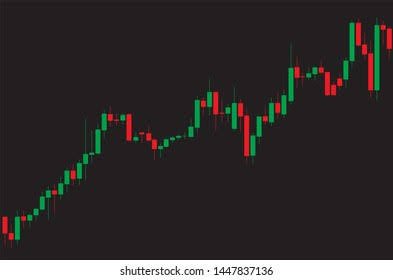
Japanese candle stick
screenshot from binance
The Japanese candle stick is a tool which is known as technical analysis to identify trend in the market and make decision. Traders use this tool to study how price of a particular asset moves.
Due to how traders have use the candle stick to read chart it has now become popular indicator used technically to analyze financial markets the candle stick deals with the (OHLC).
- the open
- the high
- the close
- and the low
The open part: it’s indicate the starting of price movement.
The heigh part: this part record the highest trading price of a particular asset at given time frame.
The low part: this part record the lowest trading price of a particular assets at a given time frame.
The close part: this part record the last price of trade of an asset that occur at that particular time frame.
Describe any other two types of charts? (Screenshot required)
Aside the candlestick chart we still have other chart which traders us analyze which are the line chart, bar chart.
line chart
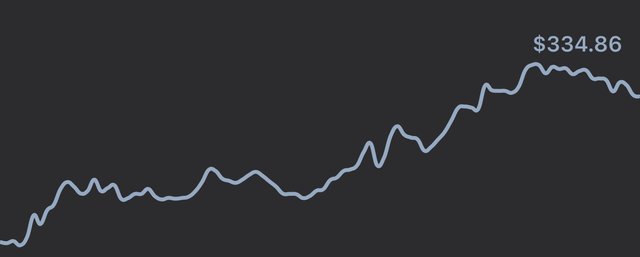
screenshot from my trust wallet
how line chart looks like
A line chart is represented in a graphical form it’s used to tell the worth of an asset in a particular time. line chart show us only the summary of were the price moved to. It’s does not provide more data like the bar and the candlestick.
The bar chart shows were price have been during all brake. It also shows the open, high, low, last and closing price for all bar. The bar chart is popular too because they provide much information for those daily traders to read and interpret them easily to make a good trading decision. In bar chart their is an opening foot it's faces the left, and a vertical line, and also a closing foot that facing the right.
In your own words, explain why the Japanese Candlestick chart is mostly used by traders.
- PRICE ACTION
It’s is mostly used by traders because of how it provide more accurate and well detailed information about price movement which traders can read and understand at a easily by looking at it at a glance compared to line chart which is somehow difficult to read and understand.
- RISK MANAGEMENT
it’s help the trader to easily identify the bulls and bears market so as to know when to make a trading choice to avoid much loss in the market ,Or make more profit too.
Describe a bullish candle and a bearish candle identifying its anatomy? (Screenshot is required)
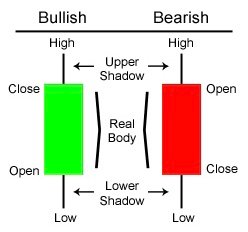
the bullish and bearish candle stick
image source
After the (OHLC) in the Japanese candle stick which has been explained above also, we have other part in a candle stick which are the shadow and the body. When the price movement of an asset is undecided that indicate the shadow part while for the body it’s indicate the distance the price have covered at a particular timeframe.
With the image above the body is the distance between open and close, them the distance between the body, is the high and low it’s known as the wick or better still shadow. Their is a minimum and maximum price the distance between the two is known as the candle range.
The chart here is of two color the red and green though you can chose any color you want but for this post it’s green and red.
The red candle stick here is indicating sell while the green is indicating buy.
the red indicating downtrend while the green indicating uptrend.
Thanks professor @reminiscence01 for your wonderful class here is my participation post Thanks once again for reading through my post.
Hello @chimezunem001, I’m glad you participated in the 2nd week of the Beginner’s class at the Steemit Crypto Academy. Your grades in this task are as follows:
Recommendation / Feedback:
Thank you for submitting your homework task.