Steemit Crypto Academy | Season 3 - Week 3 || Introduction to Technical Analysis of Price Patterns

Background Image taken from Pixabay

Once again, it is a great pleasure and at the same time, a great commitment to be in a new week of the third season of the Steemit Crypto Academy.
In the previous assignment, which you can consult in the following link Staking, we studied one of the most popular consensus mechanisms in the cryptocurrency world, the Proof of Stake (PoS), and its differences with the Proof of Work (PoW) protocol used by Bitcoin. We also learned about staking, a method that allows us to generate passive income with our cryptos and the various online platforms that offer this investment modality to their users.
Another of the fundamental aspects when deciding what type of investment to make with our crypto assets, is to know the rate of return on the investment, and which are known under the terms APY and APR, also described in the previous class. However, for those who are joining the Academy this week, it is convenient to remember that APY is a compound interest rate, where interest is calculated on the initial amount plus previously accrued interest, unlike APR, where interest is calculated on the capital or initial amount of the investment, without considering the interest that may be generated.
On this occasion, we will delve into Technical Analysis, a tool developed to study the various price patterns experienced by stocks in the world's stock markets, and which in the universe of cryptoassets has found its place among traders and enthusiasts to predict future values and minimize risks in decision making.

What is the Technical Analysis of Price Patterns?
In Technical Analysis transitions between upward and downward trends in cryptoassets are commonly signaled by price patterns.
By definition, a price pattern is a clearly recognizable configuration of price movement that is identified using a series of trend lines and/or curves. When a price pattern indicates a change in the direction of the existing trend, it is known as a reversal pattern. Conversely, it is called a continuation pattern when the trend remains in the existing direction after a brief pause.
Technical analysts have long made use of price patterns to examine current movements and seek to forecast future market movements in one direction or another.
Key Points
Patterns are the distinctive formations created by price movements on a chart and are the basis of technical analysis.
A pattern is identified by a line connecting common price points, which may be either closing prices or highs or lows, over a given period of time.
Technical analysts and cartographers seek to identify patterns as a way to anticipate the future direction of an asset's price and make decisions accordingly.
These patterns can be as simple as trend lines and as complex as double head and shoulders formations.
Trend Lines in Technical Analysis
Since price patterns are identified using a series of lines and/or curves, it is essential to understand trend lines and know how to draw them.
Trend lines help technical analysts detect areas of support and resistance on a price chart. Trend lines are straight lines drawn on a chart connecting a series of descending peaks (highs) or ascending troughs (lows).
An ascending trend line occurs when prices are experiencing higher highs and higher lows. The ascending trend line is drawn by connecting the ascending lows.
Conversely, a downward angled trend line, called a descending trend line, occurs when prices are experiencing lower highs and lower lows.
Trend lines vary in appearance depending on which part of the price bar is used to "connect the dots." While there is divergence among analysts and specialists as to which part of the price bar should be used; the body of the candlestick bar, not the thin strands above or below the body of the candlestick, often represents where most of the price action occurred and therefore can provide a more reliable point on which to draw the trendline, especially on inter-day charts where "outliers" (data that is well outside the "normal" range) may exist.
In daily charts, closing prices, rather than highs or lows, are often used to draw trendlines, since closing prices represent traders and investors willing to hold a position for a period of time. Trend lines with three or more points are usually more reliable than those based on only two points.
Uptrends occur when prices have higher highs and higher lows. Rising trend lines connect at least two of the lows and show support levels below the price.
Downtrends occur when prices are rising and falling. Downtrend lines connect at least two of the highs and indicate resistance levels above the price.
Consolidation occurs when the price oscillates between an upper and lower range, between two parallel and often horizontal trend lines.
Continuation Patterns
A price pattern that indicates a temporary break in an existing trend is known as a continuation pattern.
A continuation pattern can be defined as a pause that occurs during a prevailing trend. It is a period of time during which price declines are experienced during an uptrend, or when prices rise during a downtrend.
While a price pattern is forming, there is no way of knowing whether the trend will continue or reverse. Technical analysts generally recommend assuming that a trend will continue until it is confirmed to have reversed. In general, the longer it takes for the price pattern to develop, and the greater the price movement within the pattern, the more significant the move will be once the price breaks either above or below the continuation area.
If the price continues its trend, the price pattern is known as a continuation pattern. The most common continuation patterns include:
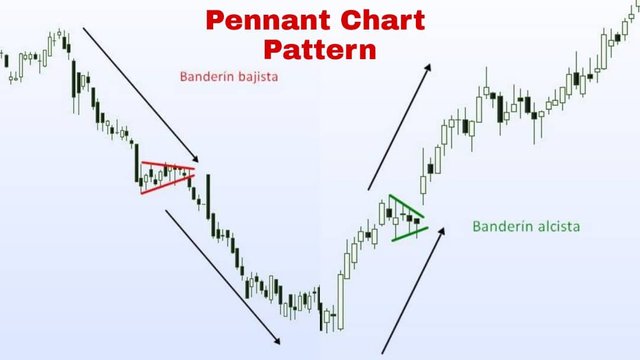
Pennants: constructed using two converging trend lines.
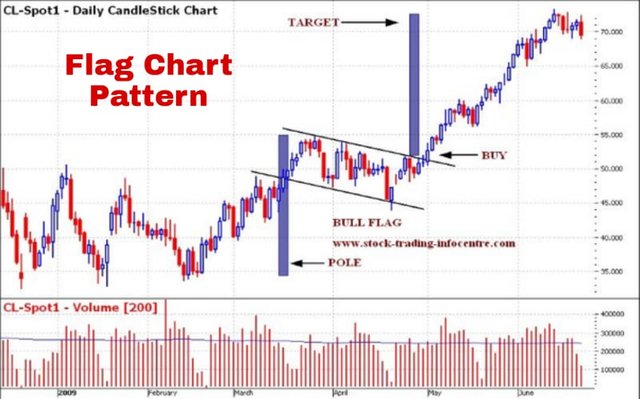
Flags: drawn with two parallel trend lines.
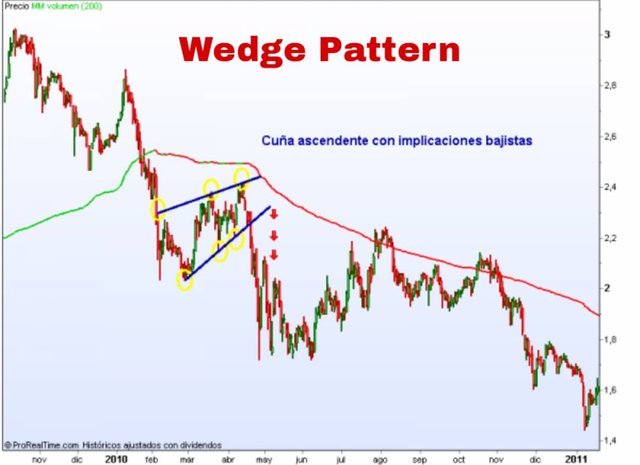
Wedges: constructed with two converging trend lines, where both are at an upward or downward angle.
Pennants
Pennants are constructed by drawing two trendlines that eventually converge. A key feature of pennants is that the trendlines move in two directions, i.e., one will be a downward trendline and the other will be an upward trendline.
Often, volume will decrease during the formation of the pennant, followed by an increase when the price finally breaks.
Flags
Flags are constructed using two parallel trend lines that can slope upward, downward or horizontally, i.e. sideways.
Generally, a flag that has an upward slope appears as a pause in a downtrending market, while a flag with a downward bias shows a pause during a bull market. Often, the flag formation is accompanied by a period of declining volume, which picks up as price exits the flag formation.
Wedges
Wedges are similar to pennants in that they build by drawing two converging trend lines; however, a wedge is characterized by the fact that both trend lines move in the same direction, either up or down.
A wedge that is angled downward represents a pause during an uptrend, while an upward-angled wedge shows a temporary break during a market decline.
As with pennants and flags, volume generally decreases during the formation of the pattern, only to increase once the price breaks above or below the wedge pattern.
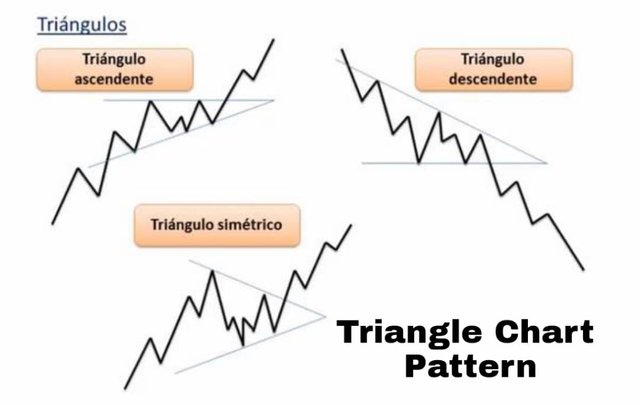
Triangles
Triangles are among the most commonly used charts in technical analysis, as they occur more frequently compared to other patterns.
The three most common types of triangles are symmetrical triangles, ascending triangles and descending triangles. These chart patterns can last from a couple of weeks to several months.
Symmetrical triangles occur when two trend lines converge on each other, and only indicate that a breakout is likely to occur, but not the direction of the trend.
Ascending triangles are characterized by a flat upper trend line and an ascending lower trend line, and suggest the likelihood of a breakout, while descending triangles have a flat lower trend line and a descending upper trend line, and also suggest that a breakout is likely to occur.
Reversal Patterns
A price pattern that expresses a change in the prevailing trend is known as a reversal pattern. The trend in the price of a cryptoasset stops, and then will head in a new direction as new forces or players emerge in the market.
For example, an uptrend supported by the enthusiasm of traders and investors may stall, meaning even pressure from both buyers and sellers in the market, eventually giving way to a downtrend.
Reversals that occur at market tops are known as distribution patterns, where the asset is sold with greater enthusiasm than it is bought. Conversely, reversals that occur at the bottom of the market are known as accumulation patterns, where the currency is more actively bought than sold.
As with continuation patterns, the longer the pattern takes to develop and the greater the price movement within the pattern, the greater the expected move once the price breaks out.
When the price reverses after a pause, the price pattern is known as a reversal pattern. Examples of common reversal patterns include:
Head and Shoulders: which signal two smaller price moves surrounding a larger move.
Double Tops: which represent a short-term swing, followed by a subsequent failed attempt to break above the same resistance level.
Double Bottoms: showing a short-term swing low, followed by another failed attempt to break below the same support level.
Head and Shoulders
Head and Shoulders patterns can appear at the top or bottom of the market as a series of three thrusts: an initial peak or valley, followed by a second and larger one and finally a third thrust that seeks to mimic the first.
An uptrend that is interrupted by an upper head and shoulders pattern may experience a reversal, resulting in a downtrend. Conversely, a downtrend that results in a head-and-shoulders bottom (or an inverse head-and-shoulders) is very likely to experience a reversal in its trend, heading higher.
Volume may decrease as the pattern develops and retrace once price breaks above, in the case of the head and shoulders, or below, in the case of the head and shoulders, the trend line.
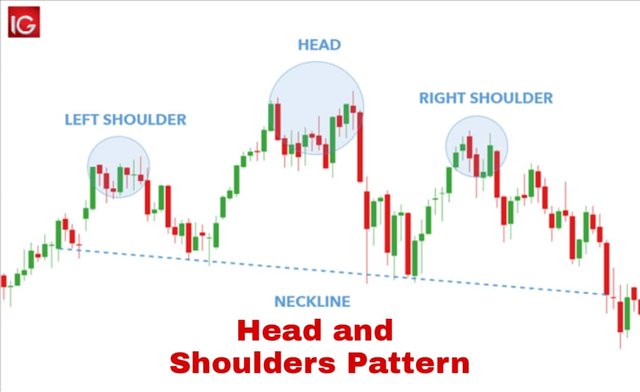
Head and Shoulders Chart Pattern
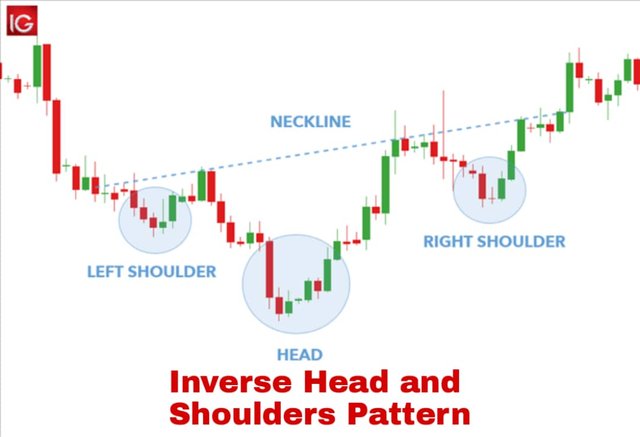
Inverse Head and Shoulders Chart Pattern
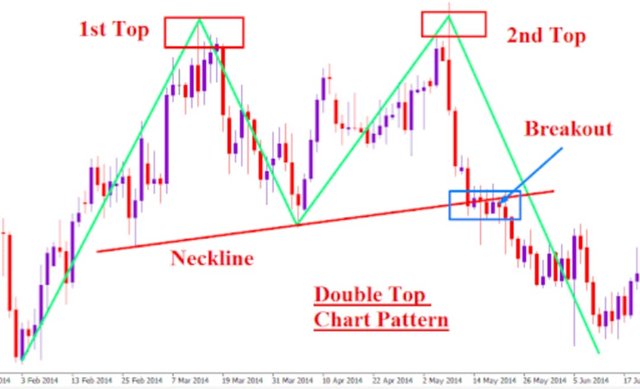
Double Tops
Double tops and double bottoms signal areas where the market has made two unsuccessful attempts to break a support or resistance level.
In the case of a double top, which often resembles the letter "M," an initial push up to a resistance level is followed by a second failed attempt, resulting in a trend reversal.
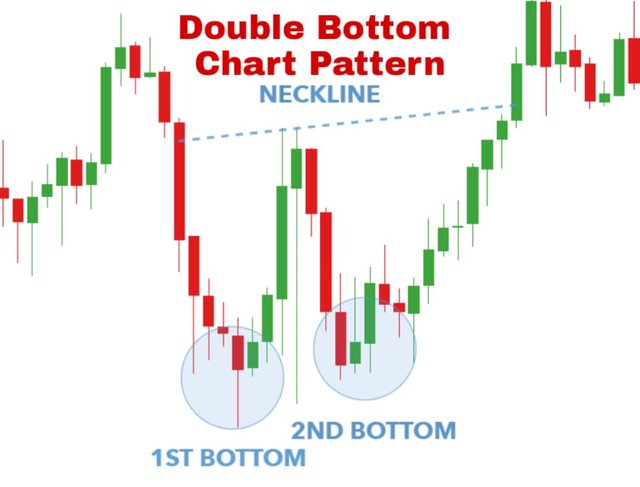
Double Bottoms
On the other hand, a double bottom, which resembles the letter "W", occurs when price attempts to break above a support level, which it fails to do and makes a second failed attempt again to break the support level. This often results in a trend reversal.
Triple tops and triple bottoms are reversal patterns that are not as frequent as head and shoulders or double tops or double bottoms, but they act similarly and can warn of a trend reversal. The patterns form when a price tests the same level of support or resistance three times and cannot break through it.
Homework Task.
1.) Perform the staking on a platform of your choice.
Which platform did you choose and why? Which wallet did you use for the procedure? Use screenshots of your own. How can you link your wallet to the platform you chose? Which coins will you staking with, what is the APY/APR (show screenshots).
Assuming the APY or APR of the coins you chose for staking and the current market value of those coins remains stable, how many coins should you have in 1 year? In US Dollars how much would that amount of coins equal?
You can use an exchange for the procedure but you cannot do staking on an centralized exchange.
Uses platforms such as PancakeSwap, MDEX, Uniswap...
2.) Pick 3 cryptocurrencies and perform a 7-day and 30-day technical analysis. Draw trend lines and describe whether the coins are in a continuation or reversal pattern. Take screenshots.
3.) How can we differentiate a bearish season from a bullish season in the market?
The graphs you use must have your Steemit username.
Guidelines
(1) Your article should be at least 300 words.
(2) This homework task expires Saturday, July 17 at 23:59 UTC (7:59 pm Venezuelan Legal Time)
(3) Eligibility Criteria--
- Must have a reputation of 55 or above
- Must have at least 250 SP (excluding any SP delegated-in)
(4) Add tag #imagen-s3week3 and #cryptoacademy in your post and should be among the first five tags. And also make sure you post in the Steemit Crypto Academy community.
PLAGIARISM AND SPAM WILL NOT BE TOLERATED
Use copyright-free images or indicate the original source


This is my homework task
https://steemit.com/hive-108451/@noraiz/steemit-crypto-academy-season-3-week-3-or-or-introduction-to-technical-analysis-of-price-patterns
Professor, question number one is still a little confusing. does staking have to be in the wallet or we are free to use any platform such as an exchange platform that offers the Stake feature.
Here you have the TOP DEX, most of these platforms offer a staking service.
https://coinmarketcap.com/es/rankings/exchanges/dex/
You cannot use centralised exchanges such as Huobi, Binance, KuCoin...
Y Justwap ?
Si, puedes utilizarla sin problemas
Here is my homework
https://steemit.com/hive-108451/@olaspecial/steemit-crypto-academy-season-3-week-3-or-or-introduction-to-technical-analysis-of-price-patterns
Hi, prof. Here is my homework.
https://steemit.com/hive-108451/@greatness96/crypto-academy-season-3-week-3-homework-post-imagen-or-or-staking-technical-analysis-and-crypto-market
Hola Profesor @imagen, la explicación de la clase ha sido bastante clara, muchas gracias, tengo algunos meses dedicándome al trading, y uso básicamente análisis técnico, así que estoy un poco familiarizado con este tema, pero he conocido algunos otros patrones, muchas gracias.
Por aquí dejo mi participación:
https://steemit.com/hive-108451/@josevas217/steemit-crypto-academy-season-3-week-3-homework-post-for-imagen-introduction-to-technical-analysis-of-price-patterns
Hello prof. Here's my assignment.
https://steemit.com/hive-108451/@uchescrib/crypto-academy-season-3-week-3-homework-post-for-imagen
My homework
https://steemit.com/hive-108451/@hibbanoor/52tn4g-steemit-crypto-academy-season-3-week-3-or-or-introduction-to-technical-analysis-of-price-patterns
My homework post
https://steemit.com/hive-108451/@avagah/steemit-crypto-academy-or-season-3-week-3-or-or-introduction-to-technical-analysis-of-price-patterns
Hi, professor @imagen, here's the link to my homework task
https://steemit.com/hive-108451/@preye2/crypto-academy-season-3-week-3-homework-post-for-professor-imagen
https://steemit.com/hive-108451/@mousumimou/crypto-academy-season-3-week-3-homework-post-for-imagen-or-or-staking-technical-analysis-and-crypto-market