Steemit Crypto Academy Season 3 - Week 3 || Introduction to technical analysis of price patterns
Hello everyone. I am going to do the homework for professor @imagen
Perform the staking on a platform of your choice.
Staking is a way to earn income by fixing/locking funds for fixed period of time. I am going to perform the staking using the trust wallet. Trust wallet is a wallet which we use to store our assets. This wallet is secure and reliable place to store our wallet for long time. We can access our assets whenever we want. We can also perform staking on the trust wallet. It is free to secure the funds on the trust wallet. Easy and simple to manage and highly secure for your funds. There are few steps to perform the staking on Trust wallet.
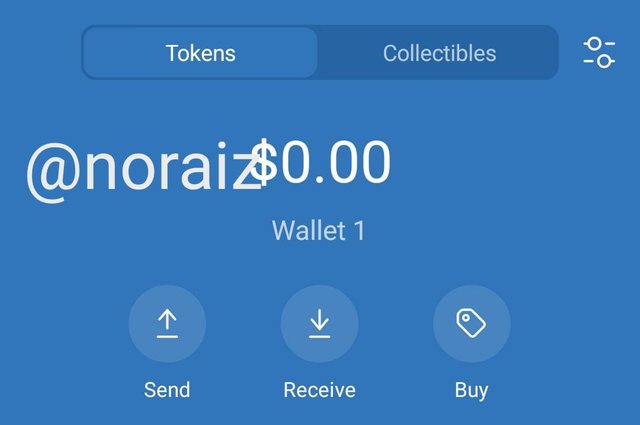
I open my trust wallet.
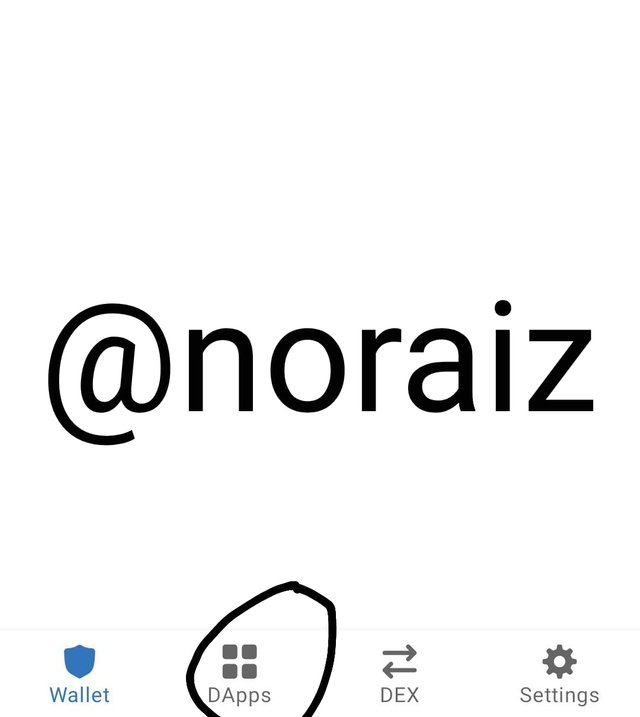
Then i clicked on the second option from the bottom list named as Dapp.
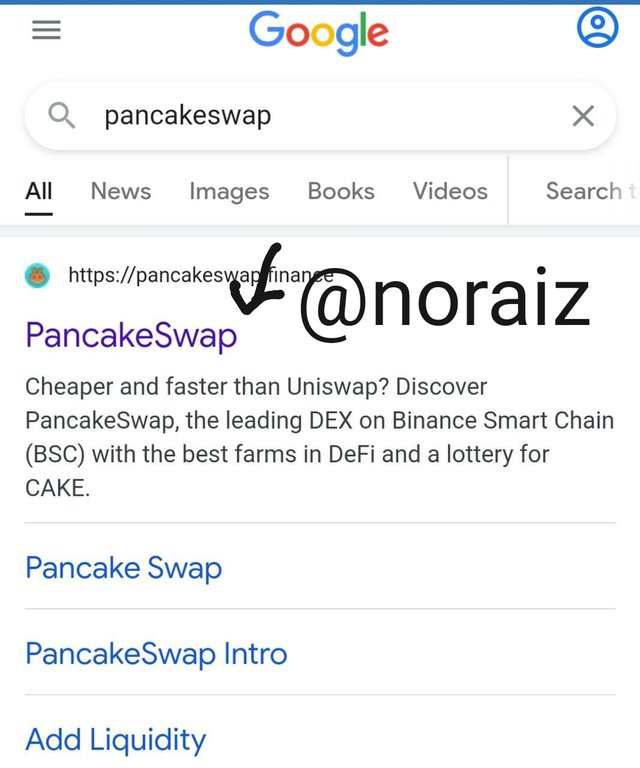
A a new window opened where i need to search for the Pancekcakeswap.
I wrote the Pnacekswap on the search bar and select the first link of next page.
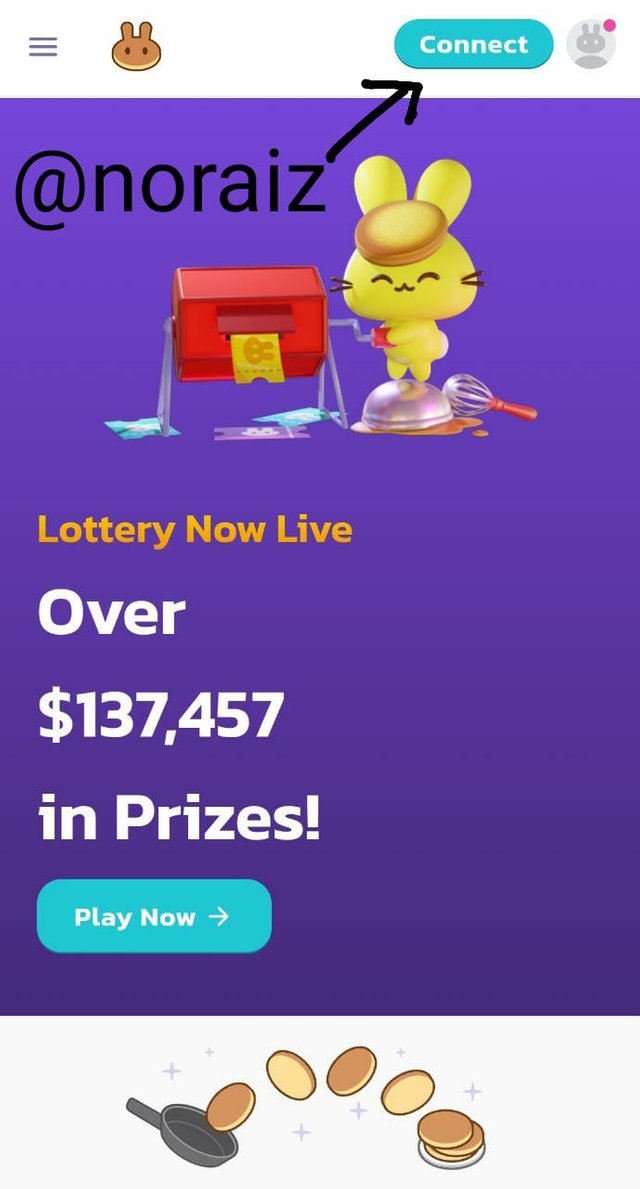
A new page will open then where i clicked on the Connect option on the top left corner.
Then i Choosed the trust wallet.
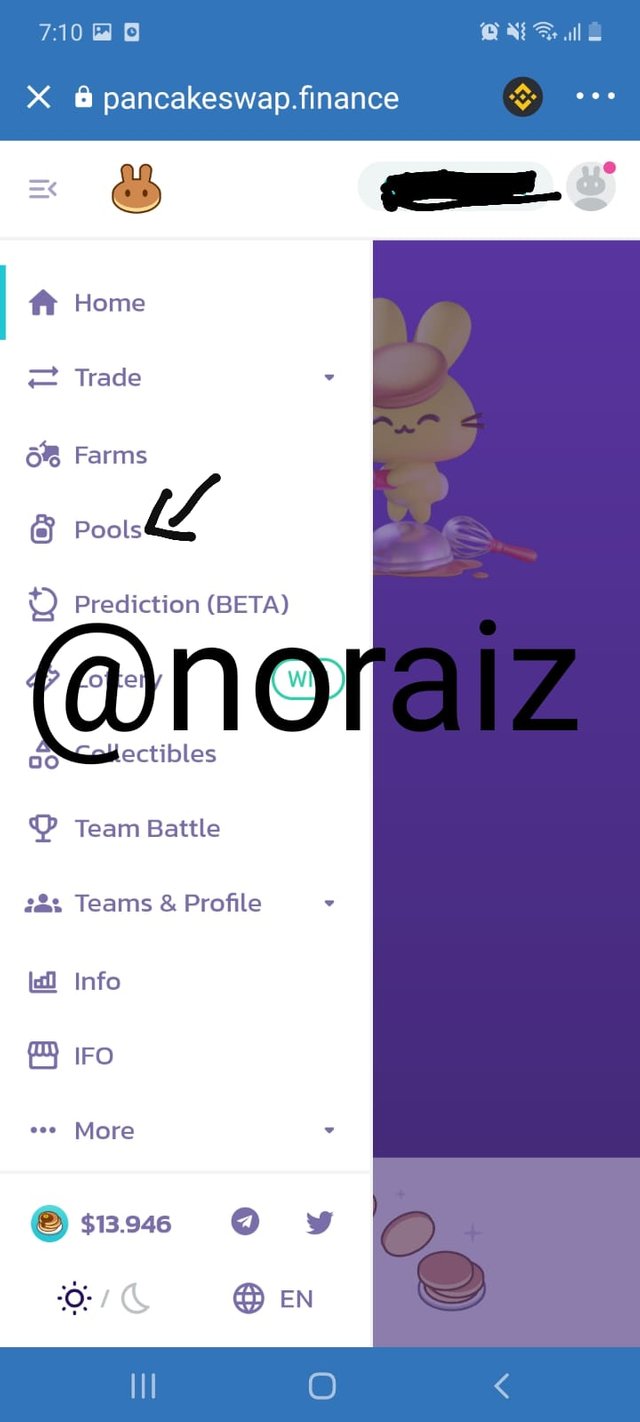
After that i clicked on the manu lines. And select the Pool option from there.
A new window opened.
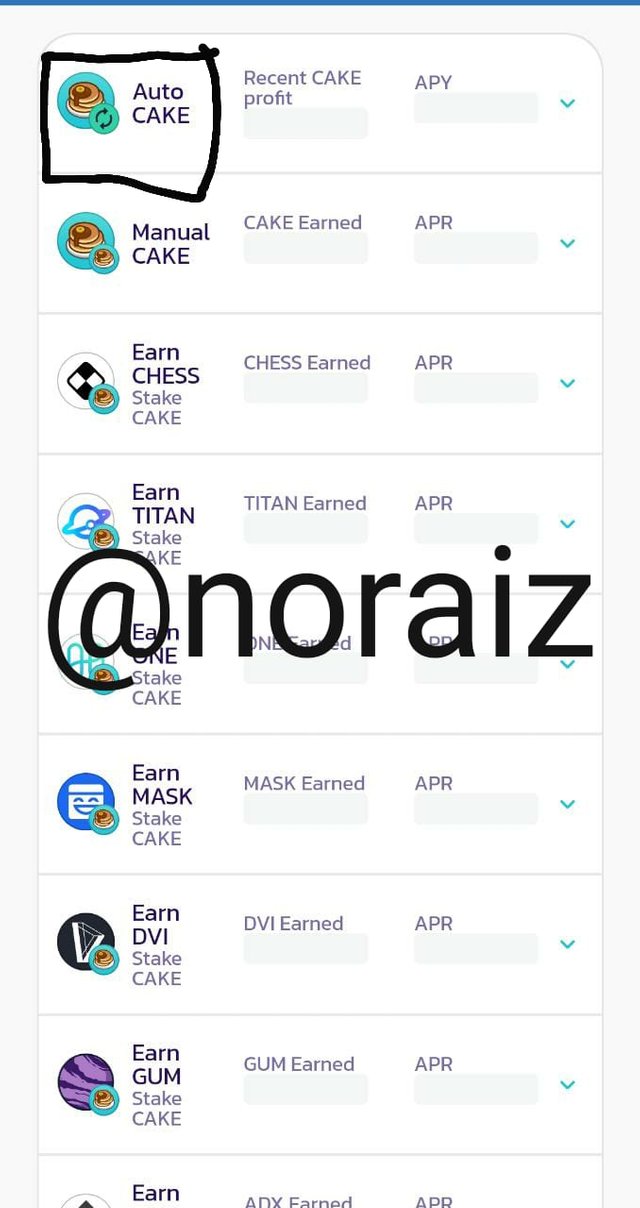
When i drop the page, i found a list of cakes. I select the first one which is Auto cake
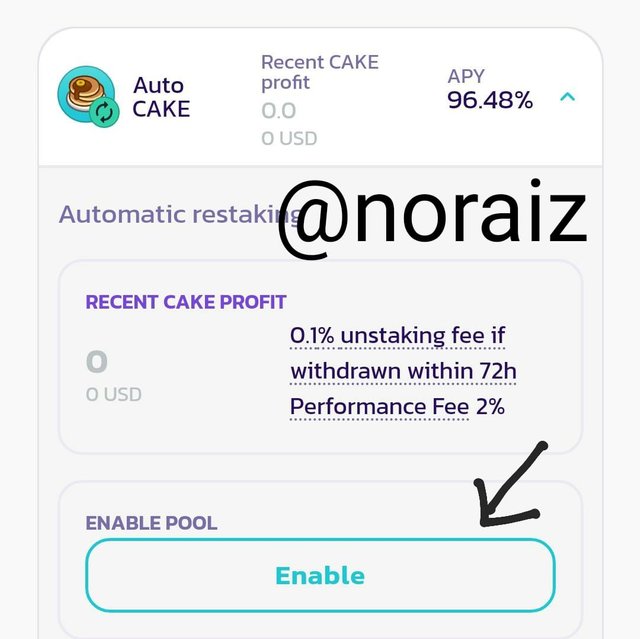
Then i clicked on Enable.
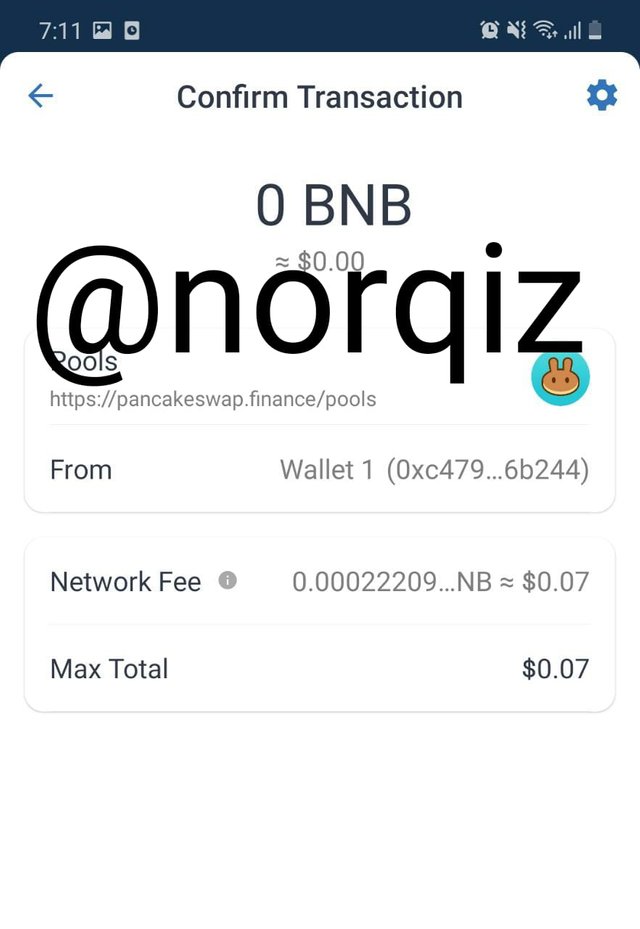
Then click on the stake and your transaction is done.
.png)
Earning on The Pool
Total ARY = 96.48%
Cake mined= 0.07
current price of pancake
Cake in whole year 0.07% x (total days in one year) = 25.55
Income of the year 25.55 x 13.92 = 355.656
Question 2- Pick 3 cryptocurrencies and perform a 7-day and 30-day technical analysis. Draw trend lines and describe whether the coins are in a continuation or reversal pattern. Take screenshots.
I am going to perform the technical analysis on Bitcoin , Cardano and Dogecoin.
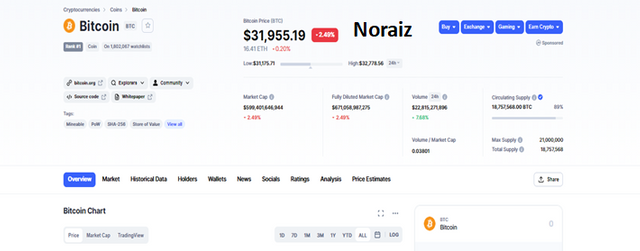
Bitcoin is the well known currency. It is the largest currency. The current price of Bitcoin
.png)
It is the largest currency with high market capitalization. Now the following is the one week chart of bitcoin.
.png)
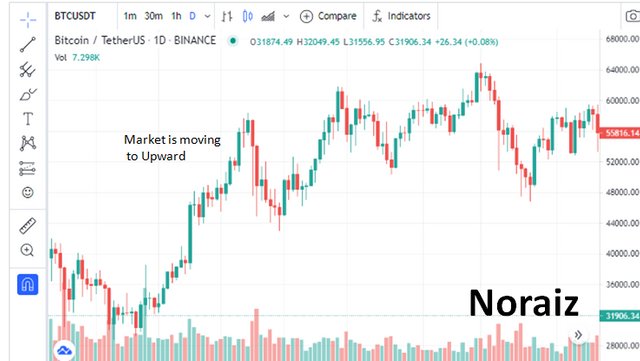
The graph is showing that there was the bullish season in market. The people were investing and demand was increasing. This situation raise the market. Then after reaching the top, people started selling to earn the high income. We can see that even there are some people who invested even at market bullish season. Then a continuous decrease is shown in form of red candle and market fall. The market currenctly is falling down.
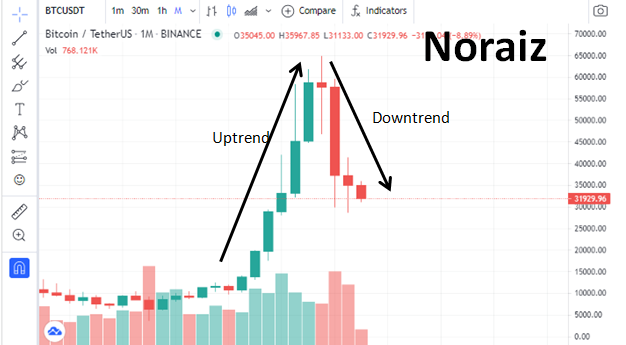
The above is the i month chart of Bitcoin. There was a continuous uptrend initially. Then a continuous downtrend can be observed. The market is still falling down. The downtrend period is good for investing.
Cardano is top fifth currency.
Below is the 1 week chart of Cardano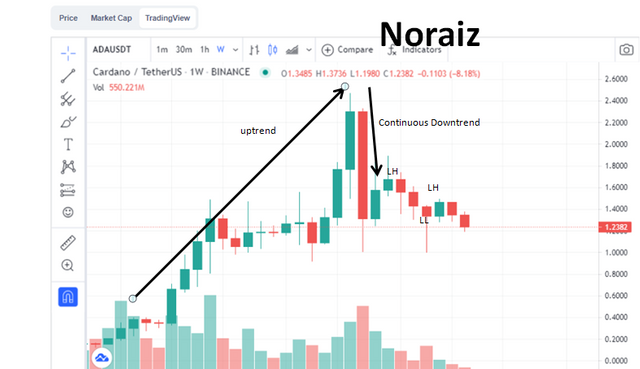.png)
There was a market uptrend. The people were investing. Sometime high-low points occur while rising toward uptrend. But then again market started moving up. The uptrend ended when people started selling their coins. Market downtrend start. Some low-high point occur while moving downward. Market is still falling down.
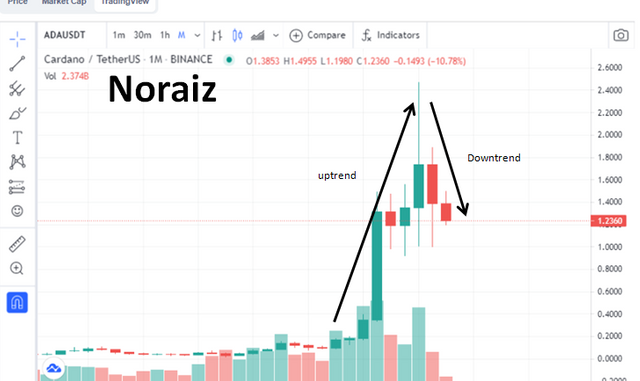
The above is the 1 month chart of Cardano. There was continous uptrend. Then a high low point come. A small selling activites were performed but then again market started rising and it reach to peak value, then people started selling the coins. This decrease the demand and downtrend started. Market is moving downward.
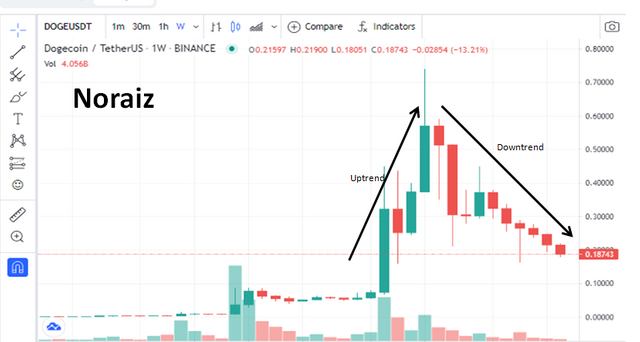
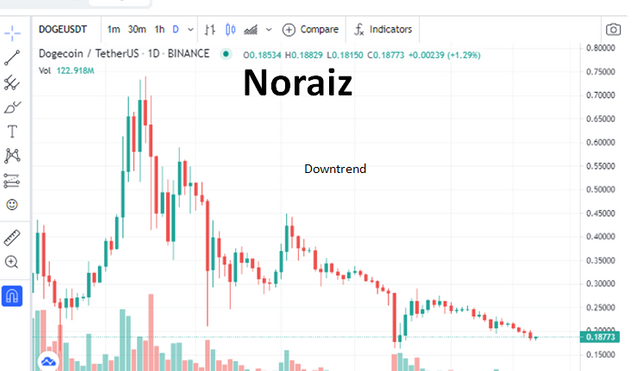
The above is one week chart of Dogecoin. The market was rising up in starting. Then people sold their coins and downtrend start. Then a lower high point occur and again downtrend continued.
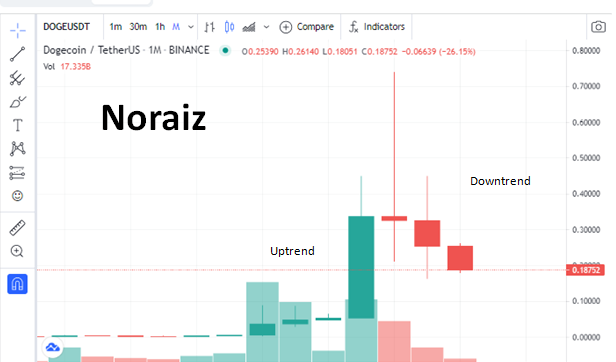
The above is one month chart of Dogecoin. We can see that there was a bullish trend. Then rising value to 0.3, the downtrend started. The market price of coin is still falling.
Question 3- How can we differentiate a bearish season from a bullish season in the market?
Bullish season/Uptrend
The bullish season start in market when price of coin rise. When price start moving upward, the market start trending upward. This is happen when the investors invest in coin. They buy the coin at low price in market downtrend. With rise of demand, the price of coin also rise. A market bullish season start when the price rise up to a certain point. The more the demand, the more rise in price. Uptrend is good time to sell the coins.
Bearish season/ Downtrend
When the market start moving downward, the bearish season start. When the market reach on the peak of uptrend, investors find it a good spot to sell their coins. They earn money but their this act cause a fall in price. The demand ratio is less than at that time to the supply ratio. The price start falling and when it cross a certain line, the bearish season start. It is also known as downtrend. The downtrend is good time to buy the coins.
Conclusion
The staking is an easy way to earn the money. I performed steps of how to stake your funds using trust wallet. Then i perfomred the technical analysis on three different coins. Technical analysis is a quite good method to predict the market next trend. Then at last, the bearish and bull season is defined in detail.
I am thankful to the professor @imagen
.png)
.jpeg)
.jpeg)
.jpeg)
.jpeg)
.png)
.png)
.png)
.png)
.png)
.png)
.png)
Thank you for participating in Season 3 of the Steemit Crypto Academy.
Congratulations, you made a great effort, however, the calculation of the amount of coins at the end of the year, is wrong. You should review the formulas for the calculation of simple interest and compound interest.
Continue to strive, I look forward to continuing to correct your next assignments.