Crypto Academy / Season 3 / Week 3 - Homework Post for @imagen || Staking, Technical Analysis and Crypto Market
Introduction
This Assignment topic. I have read two times and try to understand the main features thank professor @imagen to share this hard Course expain easily This course about Staking,Technical Analysis and Crypto Market
Staking on Pancakeswap
Now, I selected pancakeswap because it is secured and reliable to stake here. Pancakeswap is a decentralized application apps (DAPPs) and now i use it by trust wallet. It is assets supported by only BEP 20 tokens.
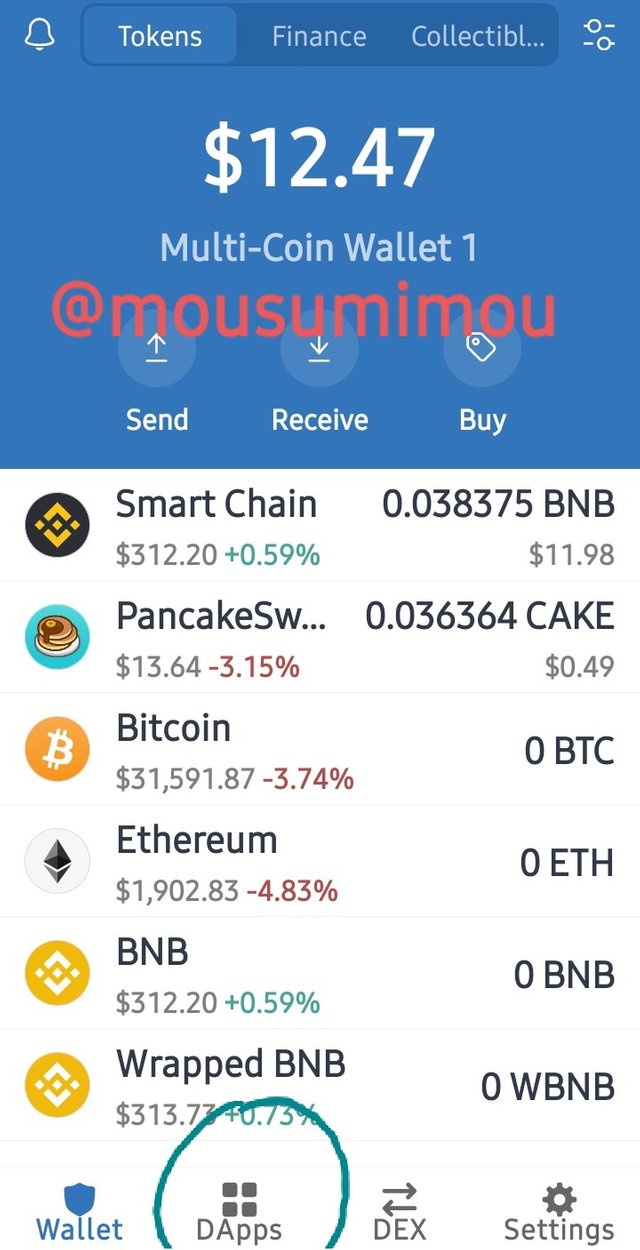
Selected Dapps and click this on the button
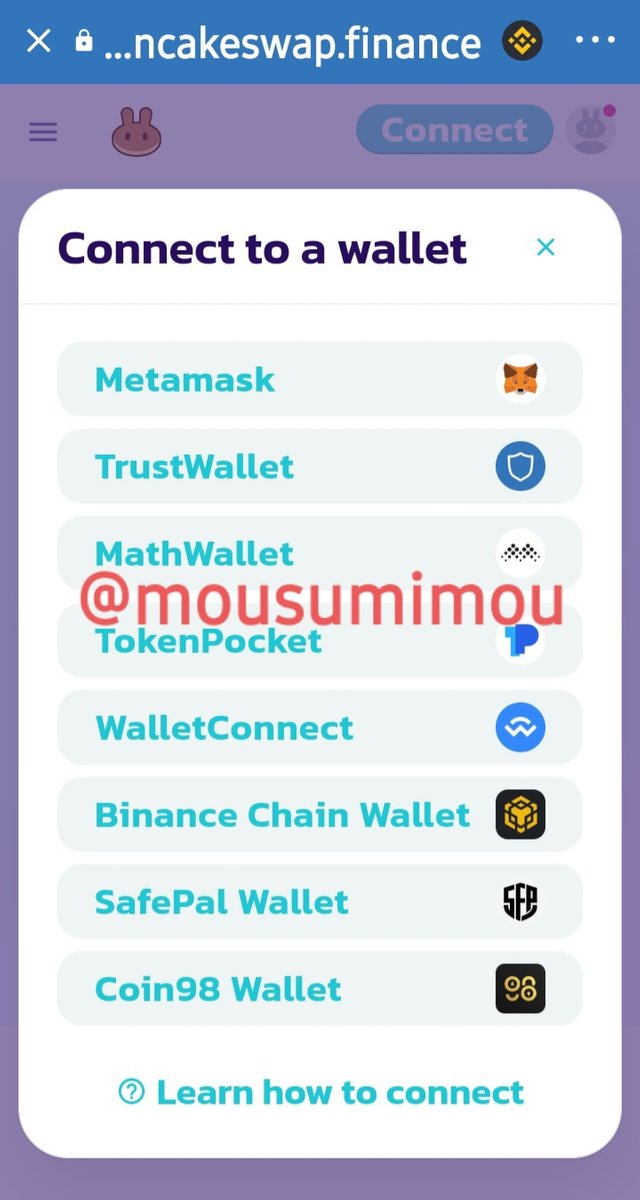
connect your Trust wallet we can see MetaMask, smart chain wallet or also.
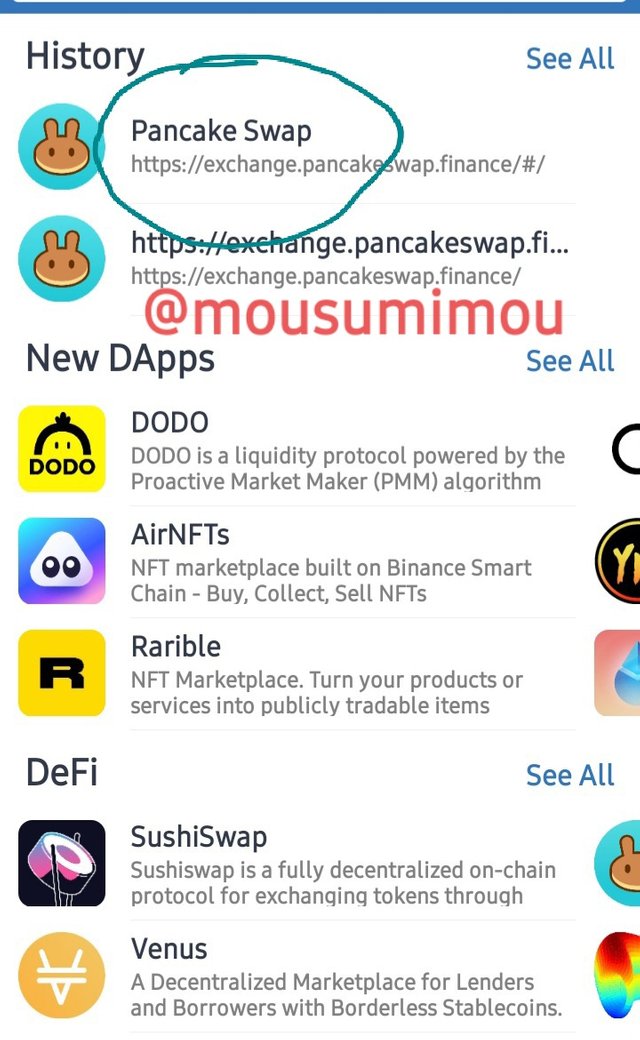
You searching it or you see under pancakeswape and click this on
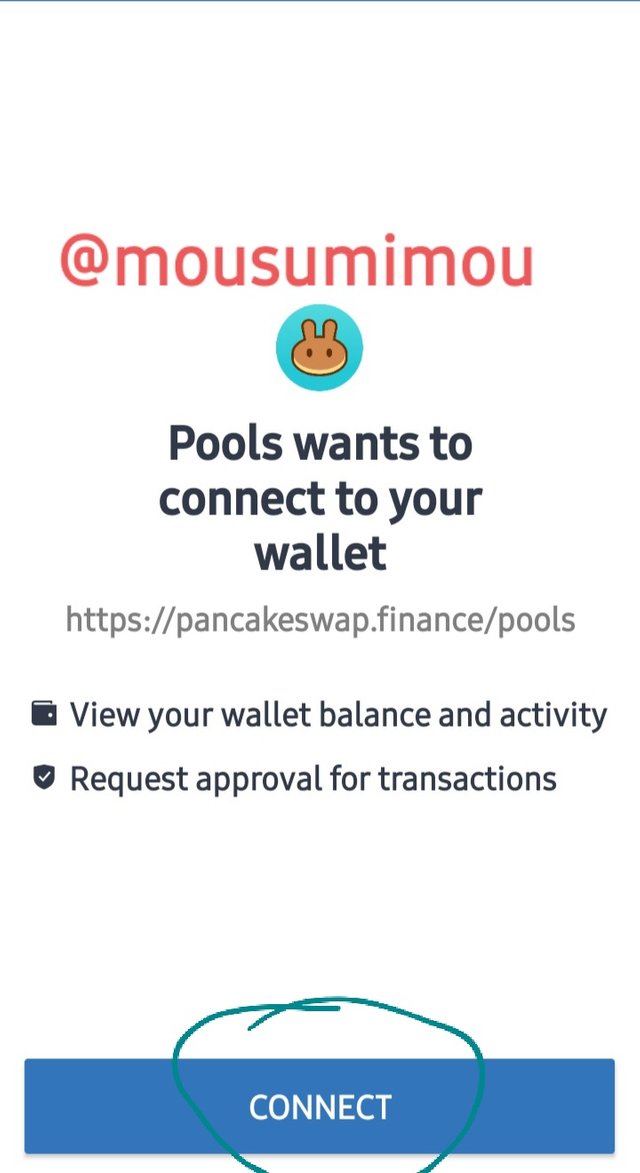
And do the connect
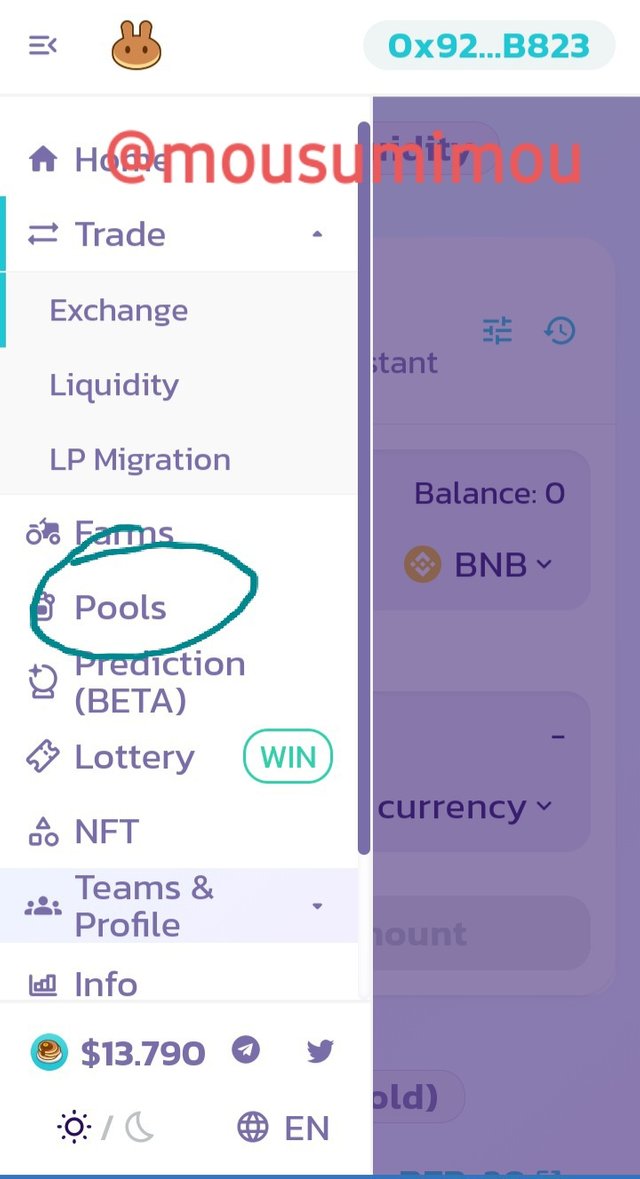
click 3 dot button and see the pools options and click that
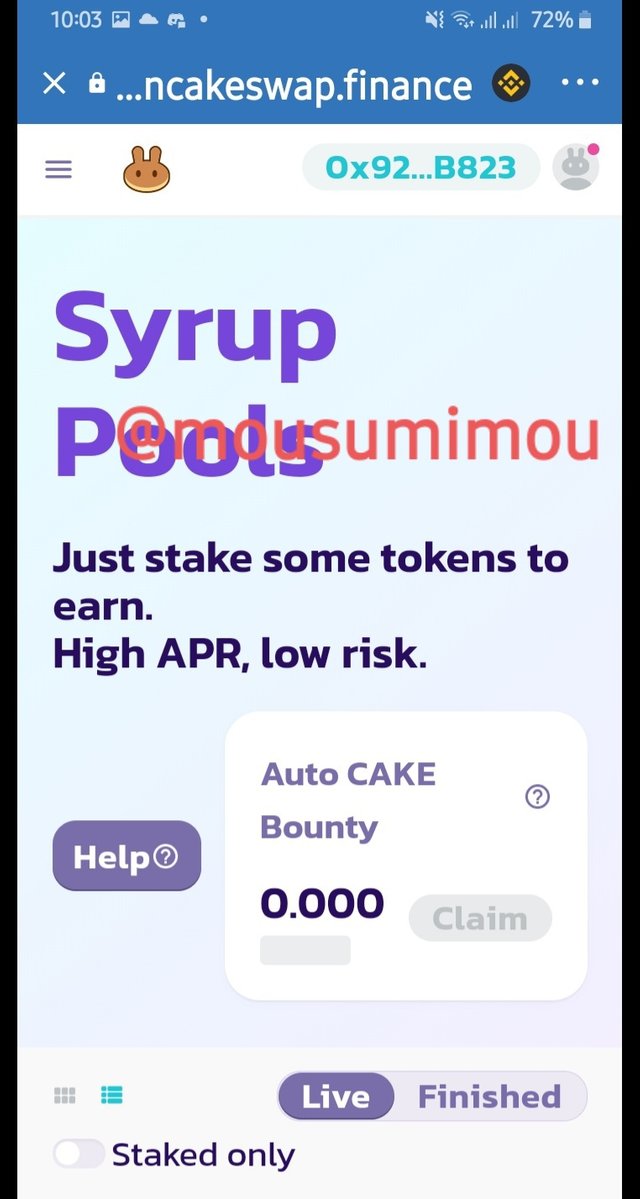
click enable options than you see stake
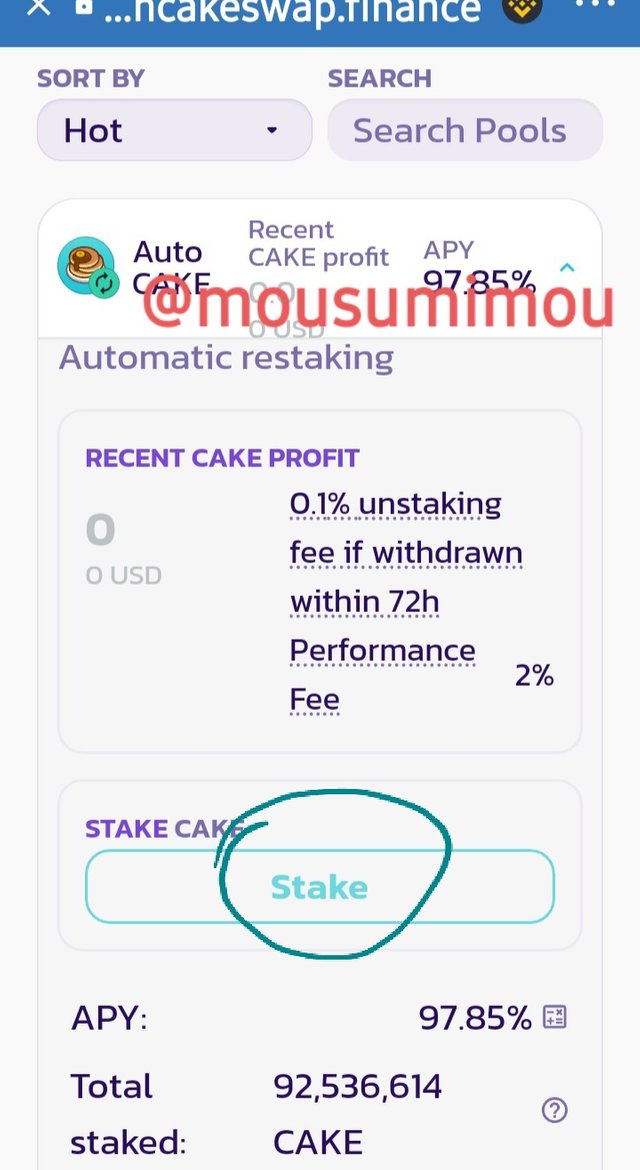
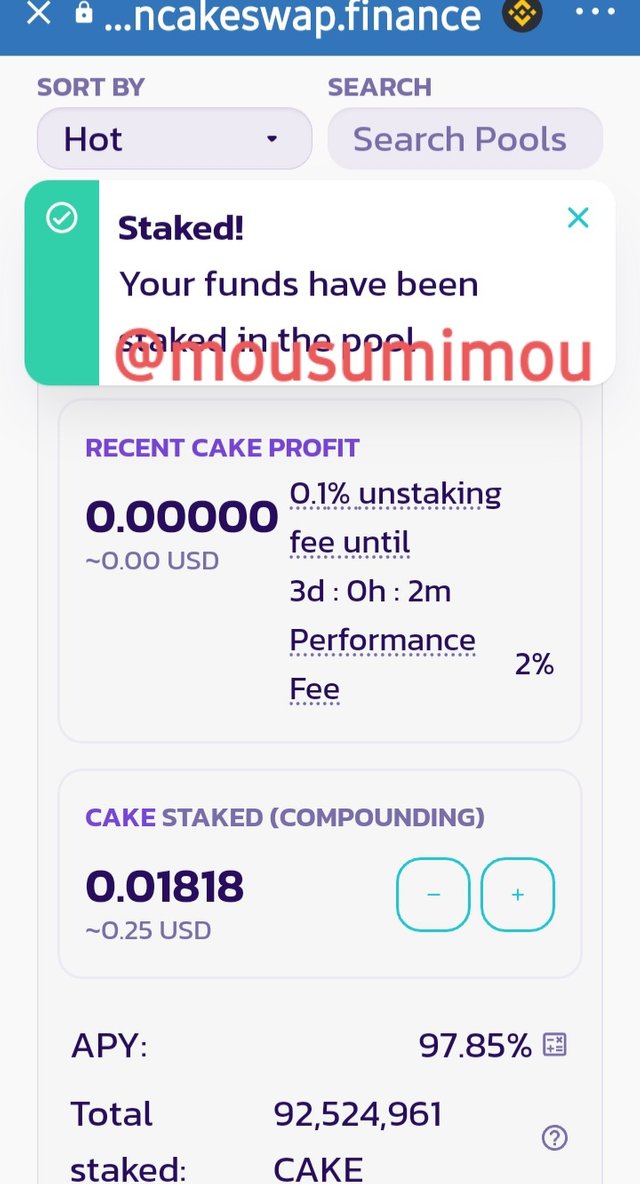
Click the stake options and wait few second for confirm
Possibility earning form The Pools
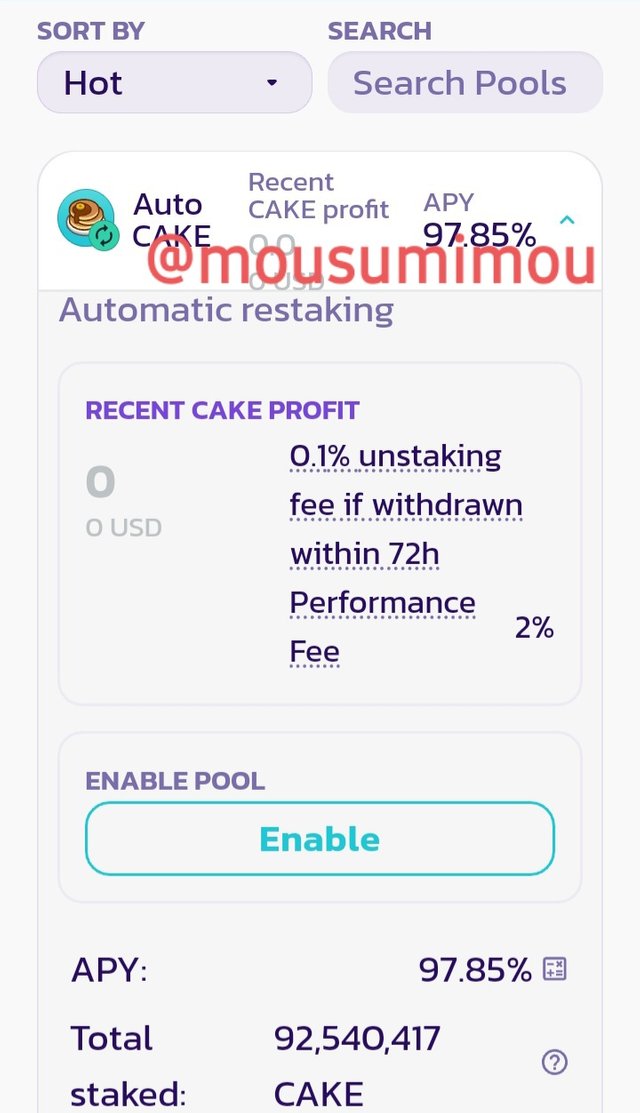
The APY here is 97.85% and my 0.01818 if my cake mines 0.01 cake per day. End of the year in is 365 days, I will earn 0.01365=3.65 cake tokens. Now cake price of $13.570/cake, my earning for one year on the pool will be 3.6513.570=$49.53.
Three cryptocurrencies and Technical Analysis BTC, ETH, ADA
Here I selected BTC, ETH and ADA.
7-Day Analysis of BTC
From the graph below, there is an uptrend as the price moves up due to a buying pressure at point and Downdrend for selling pressures . thus forming a point for the uptrend line to rest on.
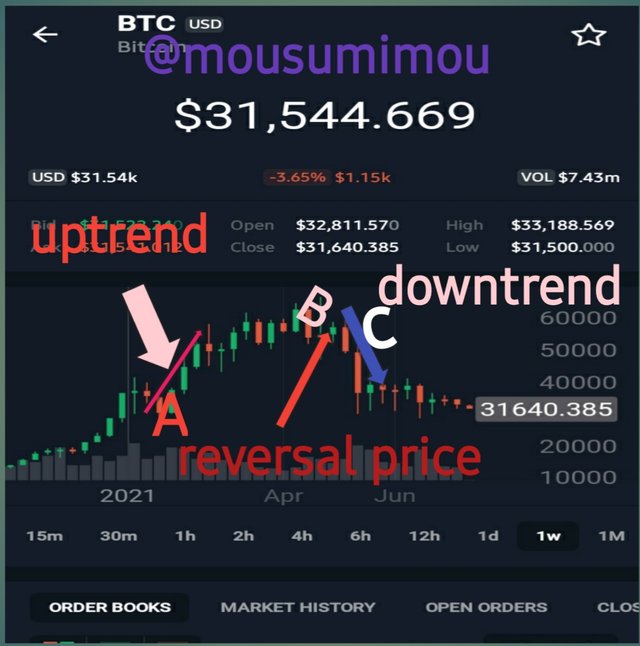
The support at point A wasn't strong as the price enhanced more til there was a a lof of selling pressure at point B somewhat less the buying pressure. B is resistance level than C red signal means selling pressures use so that btc price downtrends. We saw that that was the support point the chart showed a double top pattern.
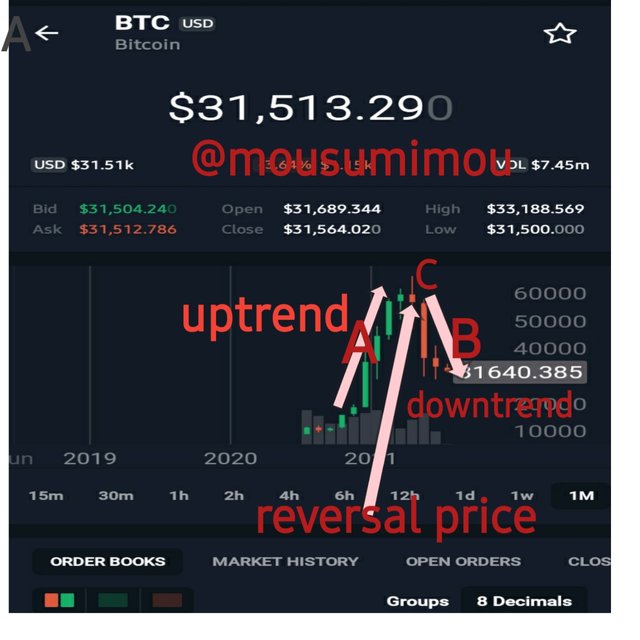
30-days BTC Technical Analysis
At point A there is a continuously buying pressure, for that enhance to an uptrend on the chart. This is ceased at point C where there is price reversal, lead to for a downtrend.
7days -ADA Technical Analysis
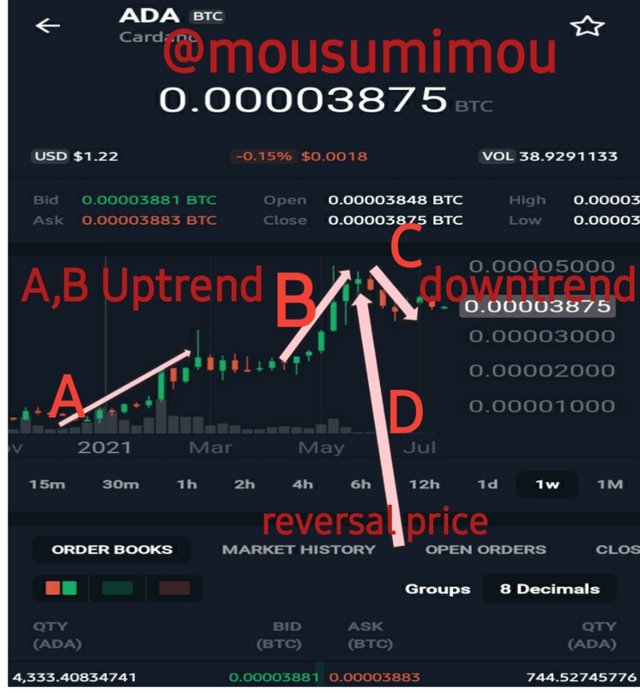
The two points A and B there is a continuously uptrend for buying pressure D price reversal at point C leads to a downtrend caused for selling pressure.
30-Days ADA Technical Analysis
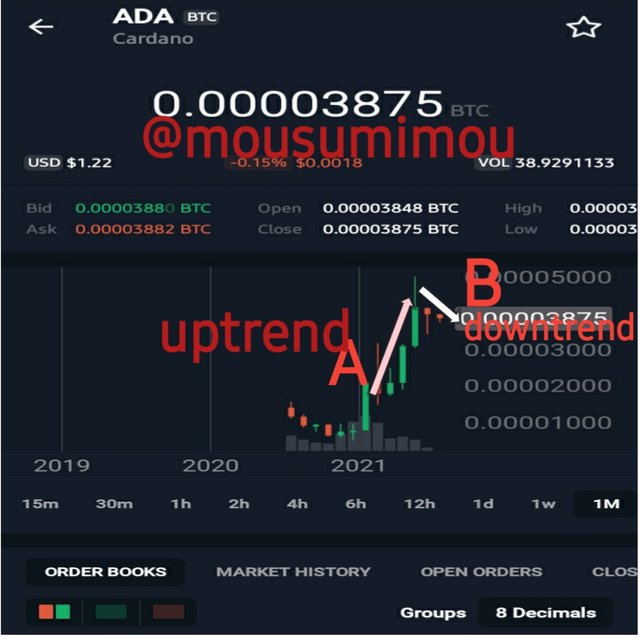
Here, the market have a buying pressure leading to an uptrend at point A and a somewhat selling pressure took the market to a downtrend at point B.it is called flag chart
7-Day ETH Technical Analysis
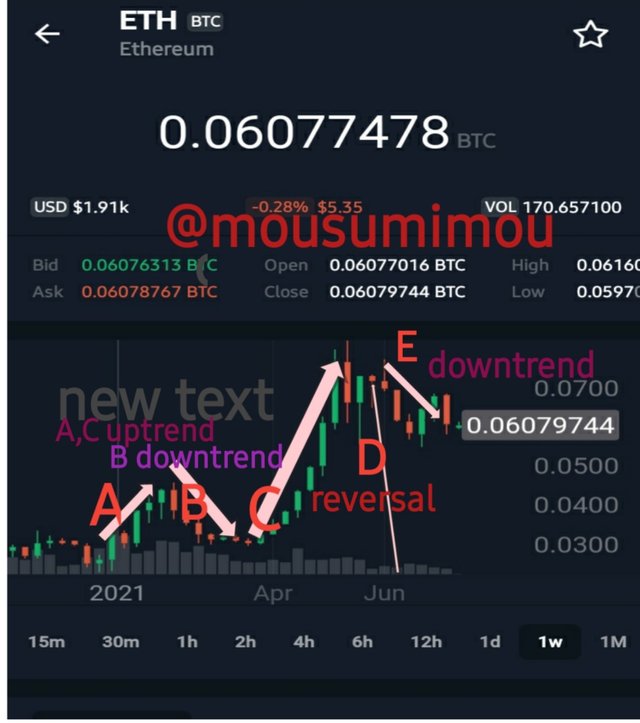
Here there are uptrends on points A and C. A is uptrends but suddenly down market B is downtrend. D is residence point E is downtrends for somewhat selling pressures.
30-Day Technical Analysis of ETH
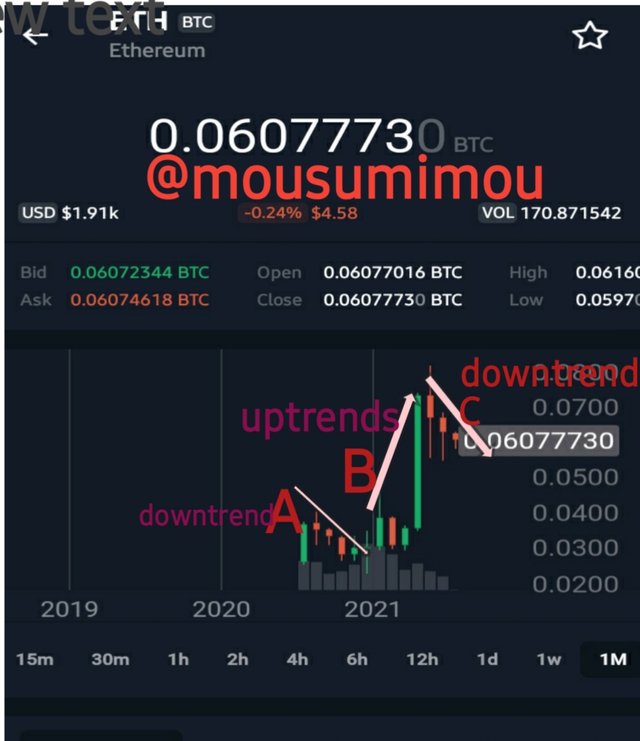
At point A is downtrends for selling pressures but B is uptrends for buying pressure again slowly enhance buying pressure than C continuously downtrends. ,
Difference Between a Bearish Season and Bullish Season in Crypto Market
Bearish patterns
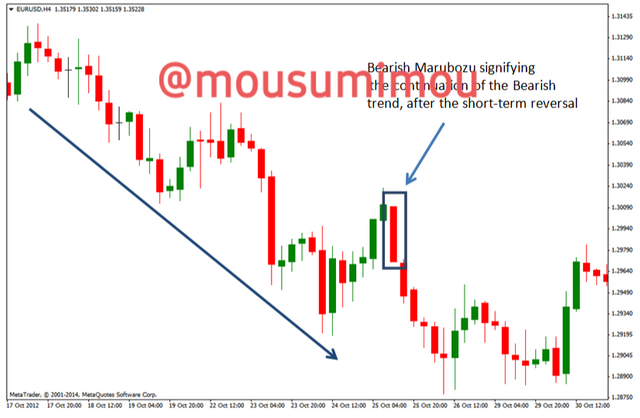
The bearish season means it is a time of continuously downtrend with subsequent resistances. It is happen when spread propaganda is market tader continuously sell his or her currencies . Bearish time all holder stay with loss and need patience. Some bad news create fearness with trader than they compel to sell their token or coins. We saw that , the market has been bearish in the past months. Simply put, bearish means down market. It is called of downtrend.
Bullish patterns
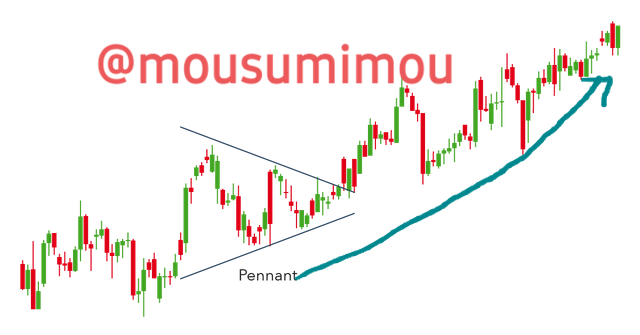
On the other hand, Bullish means up market. Bullish time is a period of continuous uptrend. That time we saw that the chart as buying pressure keeps the price of the asset up. Some for long time or short time. During this period, the chart shows a continuously uptrends with periods supports on it.Bullish time happy moments for all trader
It is depends on , bullish season is main reason by buying pressure and the news is good, while bearish season is caused by selling pressure when the news is bad or propaganda so on.
Conclusion
Staking need to known for everyone trader and if she or want to proper ways trade and want to acquired knowledge.Technical analysis also important a sure way to ensure the future activities in market . if we properly analyses our loss possibility will be reduce and don't care propaganda or bad news.staking and technical analyses need for every trader other trader will be lose. They don't earn healthy profit.Cryto market is the Risky place all time to open eye and earns. .
Thank you for reading.
Thank you for participating in Season 3 of the Steemit Crypto Academy.
Congratulations, you made a great effort, however, the amount of cakes mined daily is 0.00004873 (0.01818 x (0.9785/365)), which multiplied by 365, gives 0.01779 cakes that added to the stake amount of 0.01818, gives a total of 0.03597 at the end of 1 year .
Continue to strive, I look forward to continuing to correct your next assignments.