Crypto Academy / Season 3 / Week 3 - Homework Post for @imagen
Introduction
I'm so glad to join this week's cryptoacademy tasks. This week's topic gave an in-depth explanation on how to identify chart patterns and how these patterns are used in technical analysis. On this note, I'll handle the tasks.

Staking on Pancakeswap
I chose Pancakeswap for my illustration because it is easy to use and incurs little costs. Pancakeswap is built on the smart chain network which offers fast transaction speed and little fees. Also, this decentalized platform offers high returns on staked tokens.
Steps for Staking on Pancakeswap
For my illustration, I used Trustwallet application for Android.
Step 1: Open the Trustwallet application. Select DApps.
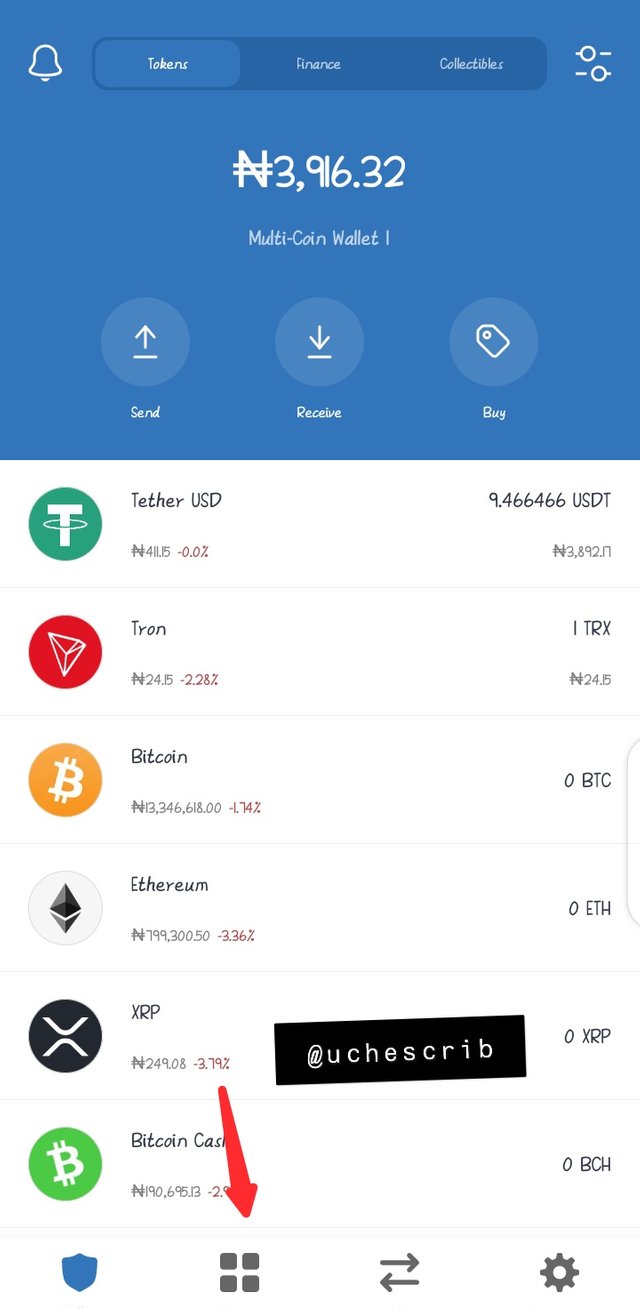
Step 2: Select "Pancakeswap". You can alternatively type the URL into the search bar. https://pancakeswap.finance/

Step 3: Wallet already connected because Trustwallet is a web3 browser.
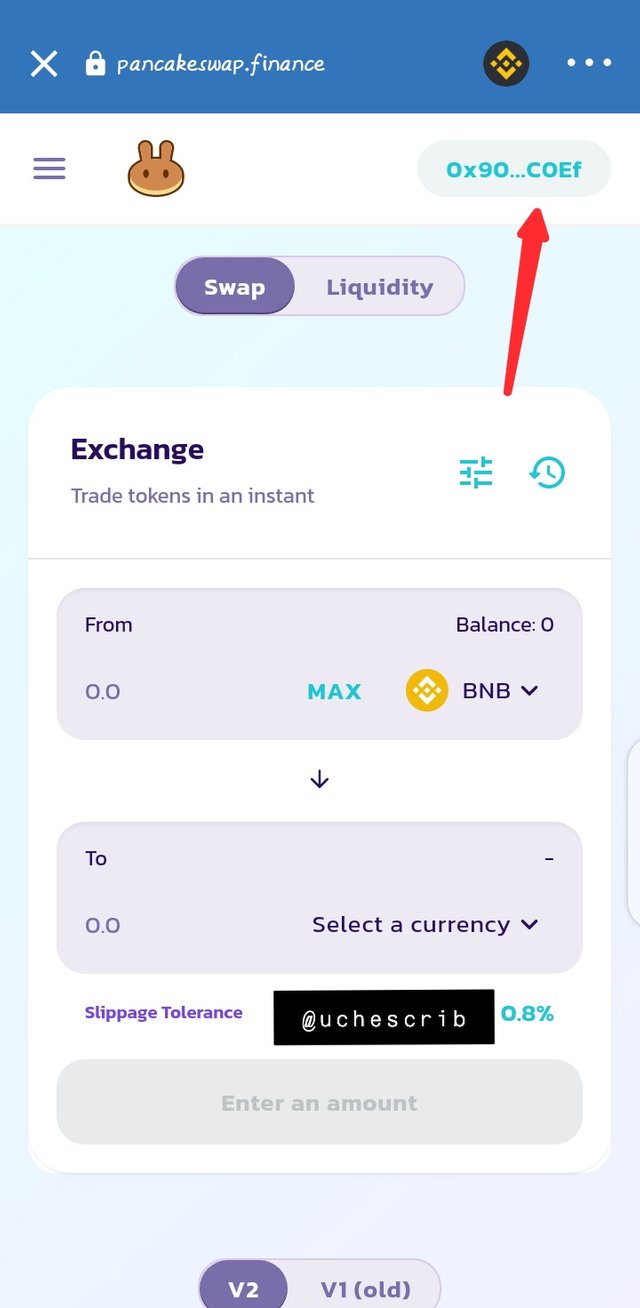
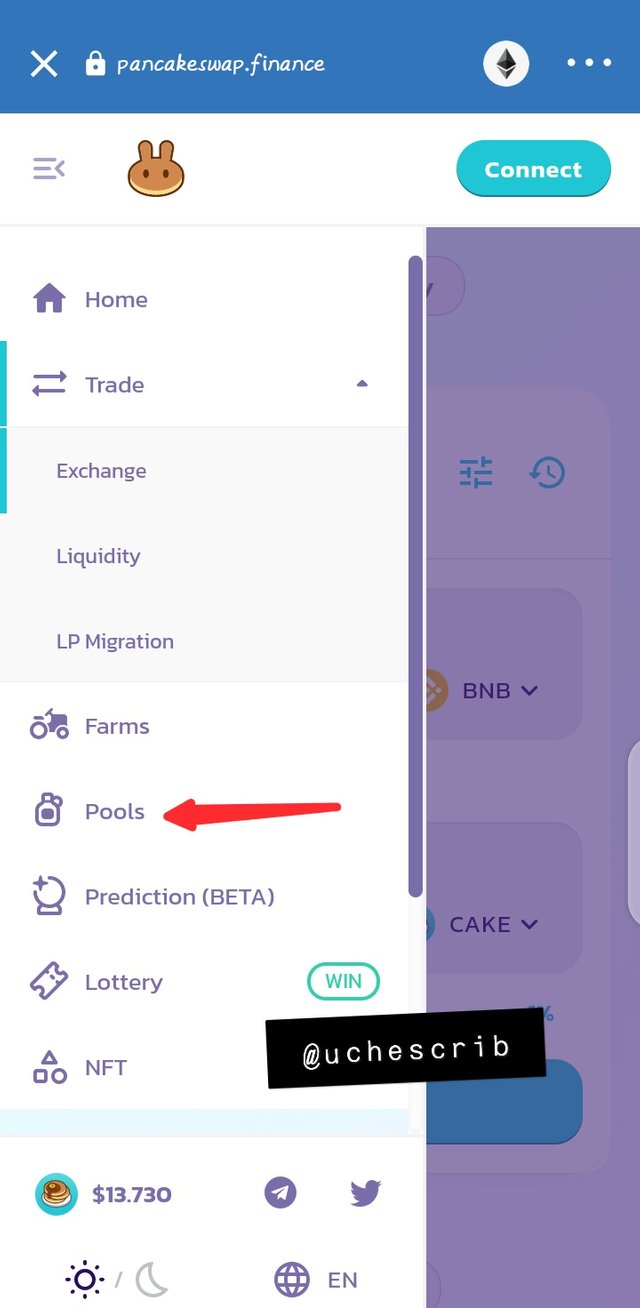
Step 4: Select the options menu at the top left corner.
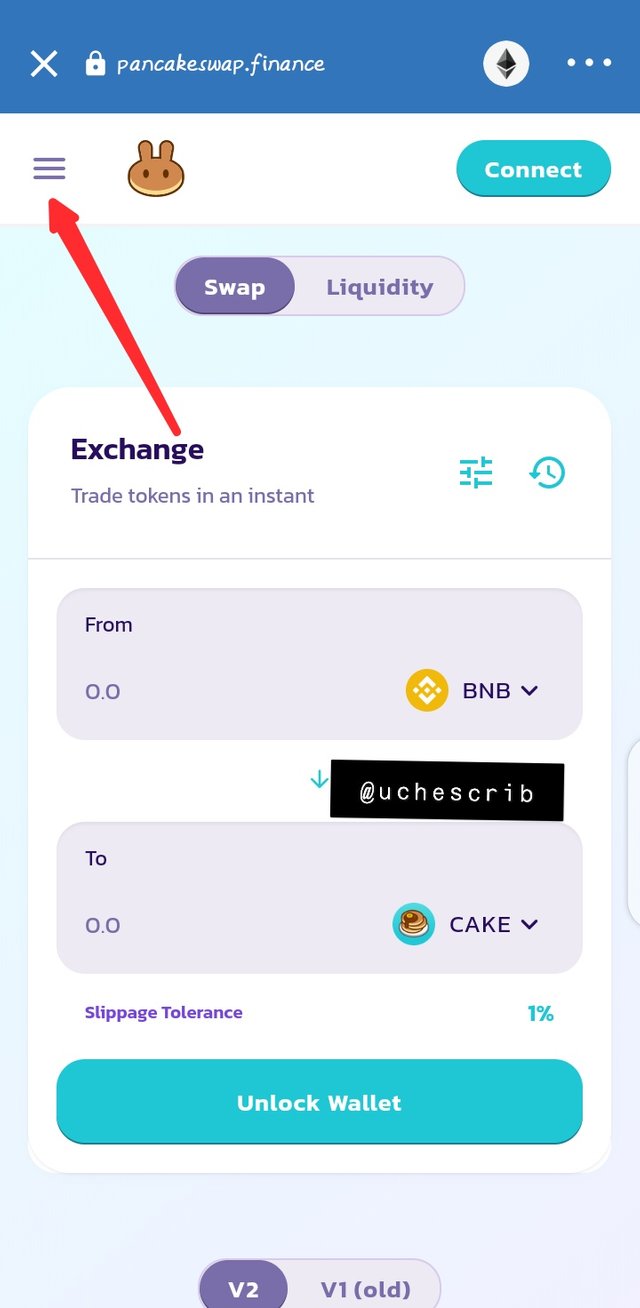
Step 5: Select "Pools".
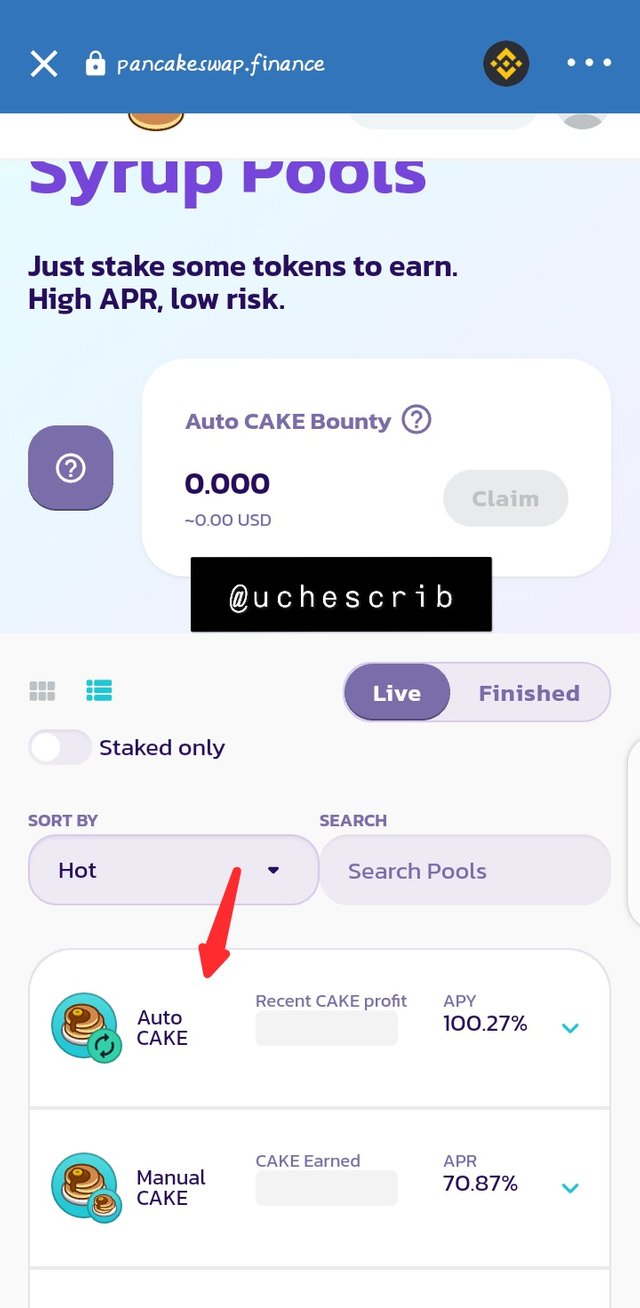
Step 6: Select "Auto Cake".
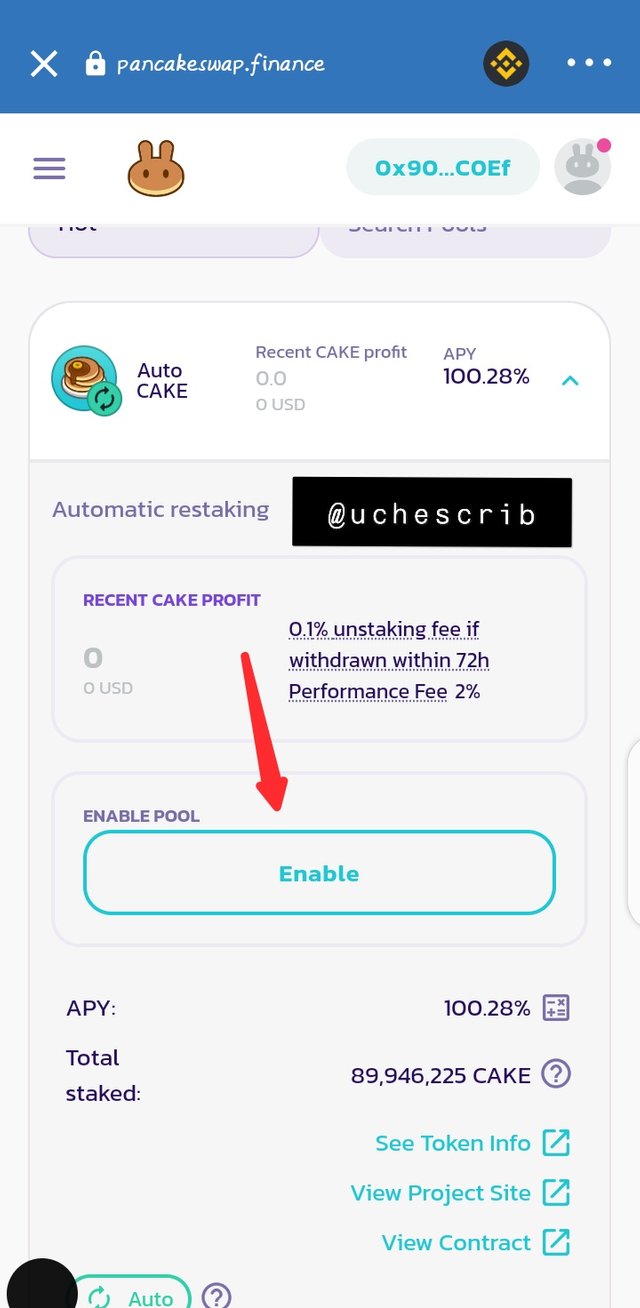
Step 7: Select "Enable".
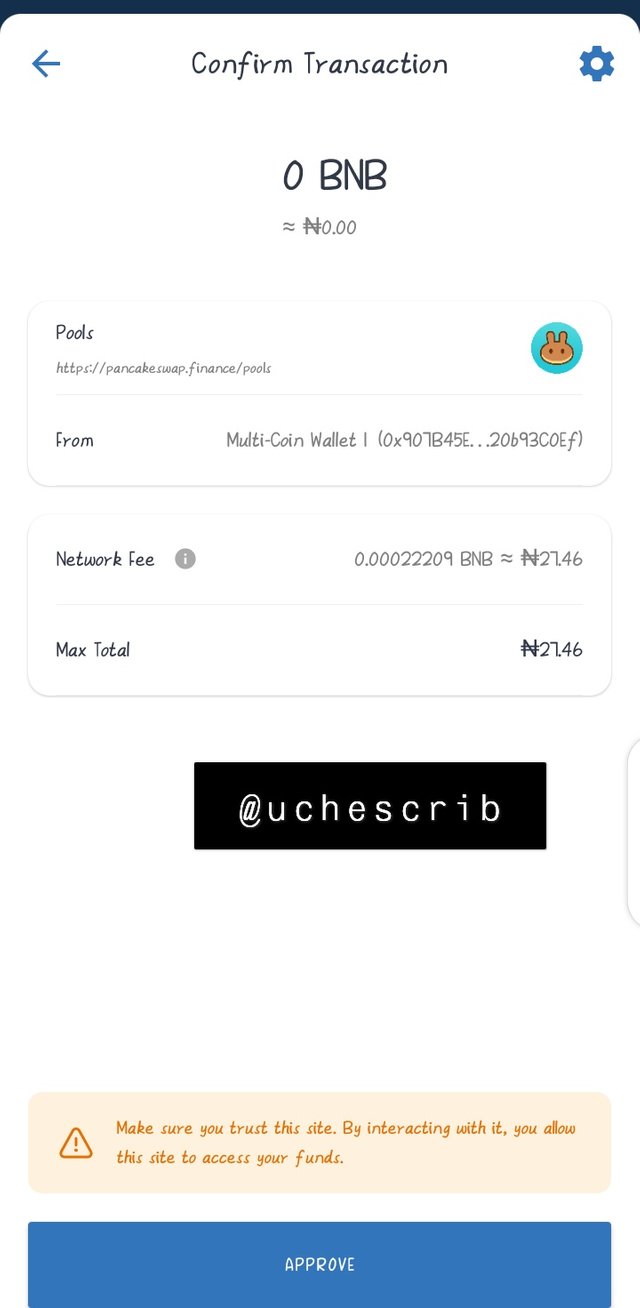
Step 8: Approve the smart contract.
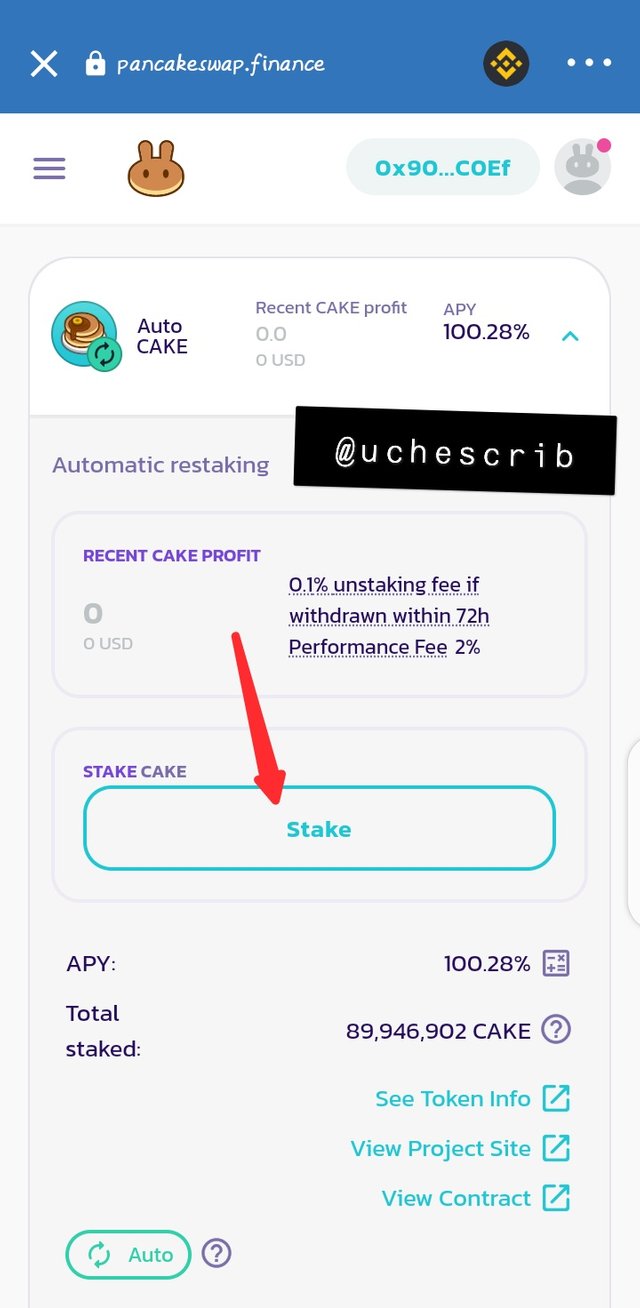
Step 9: Select "Stake".
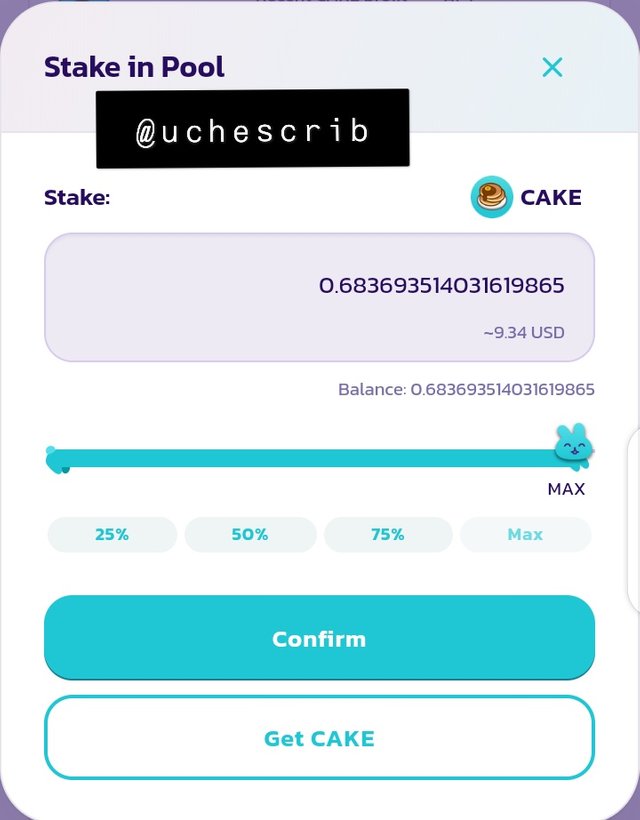
Step 10: Select amount of Cake to stake and click confirm. In my illustration I staked all my Cake tokens.
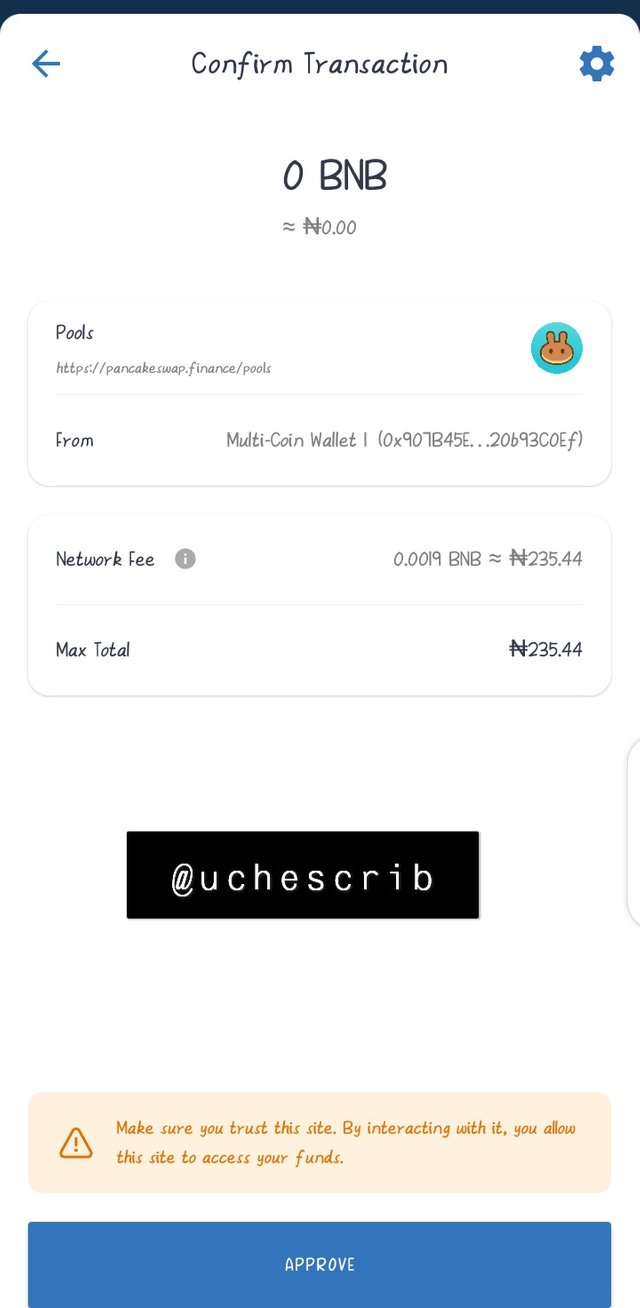
Step 11: Approve smart contract.
Step 12: Staking has successfully been completed.
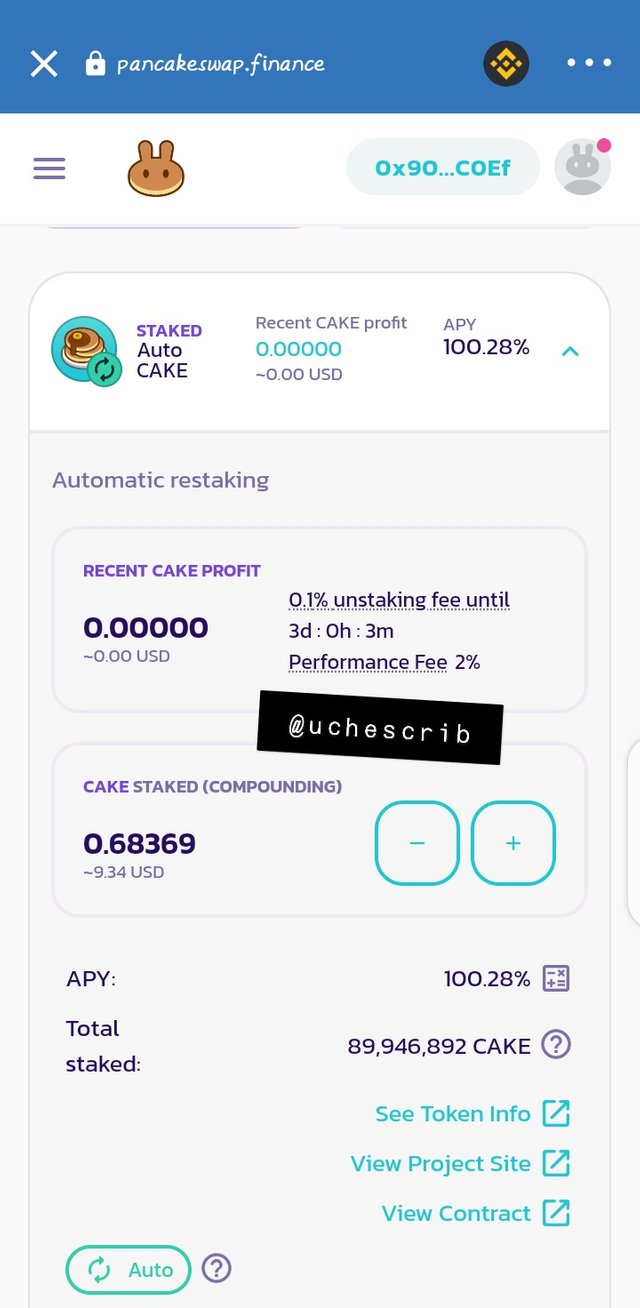
I staked 0.68369 cake which is equivalent to 9.34 USD at an APY of 100.28%.
Using the formula: C.I=P(1+r)n-P
where;
C.I = Compound Interest
P = Principal = 0.68369 cake
r = rate = 100.28% = 1.0028
n = number of compounding years = 1
C.I=0.68369(1+1.0028)1-0.68369
C.I = 0.685604332 cake
∴ Amount at the end of year = P + C.I
Amount = 0.68369 + 0.685604332
Amount = 1.369294332 cake
This is equivalent to 18.706152 USD at the rate of 13.6611622226447659026751 USD per Cake

Analysis on Bitcoin
7-day Analysis on Bitcoin
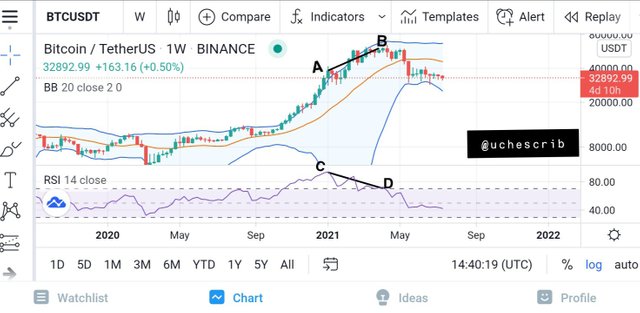
Notice points A, B, C and D. These points show a bearish divergence on the price chart and the Relative Strength Index. The 20-SMA of the Bollinger Bands indicator crossed the price chart and is above the candlesticks. This signifies that Bitcoin is currently on a bear trend.
30-day Analysis on Bitcoin
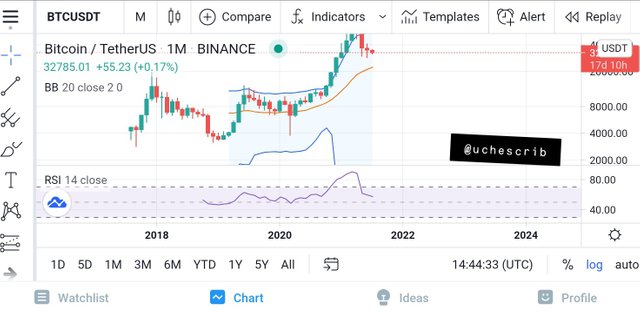
The 30-day chart shows that Bitcoin is currently on a downtrend. The RSI indicated the strength of the long bear candle move. The price seems to be making a minor bear move which is indicated with the SMA of the Bollinger Bands. I'm predicting that price would touch the SMA and rebound towards the uptrend.

Analysis on ETH
7-day Analysis on ETH
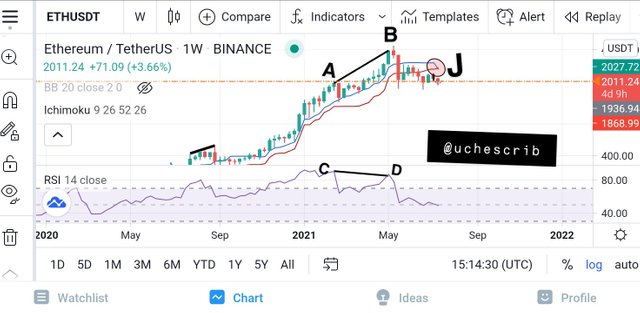
Points A, B, C and D show a bearish divergence in relation with the Relative Strength Index. This implies that a bear move would be experienced on the ETH market. I incorporated the Ichimoku indicator and made only the conversion line and base line visible. These two lines have crossed the price chart and are currently above the candlesticks. Point J shows an interest between these two lines. As the conversion line (blue) intersects and is below the base line, it signifies a bear move in the price of ETH.
30-day Analysis on ETH
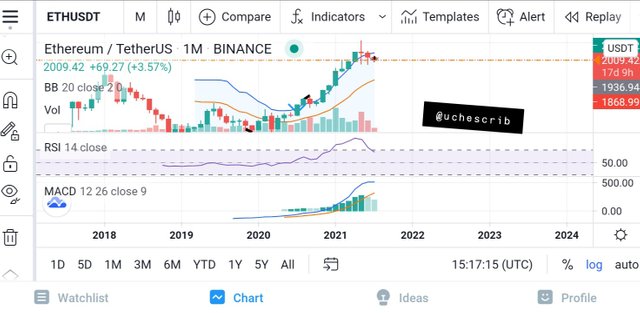
After it's all-time high some months back, ETH has shown a pullback from the current uptrend. Using the volume on the MACD indicator, it is observable that their is decreasing volume in the market. The MACD line is tending to the signal line which indicates downward movement of price.

Analysis on XRP
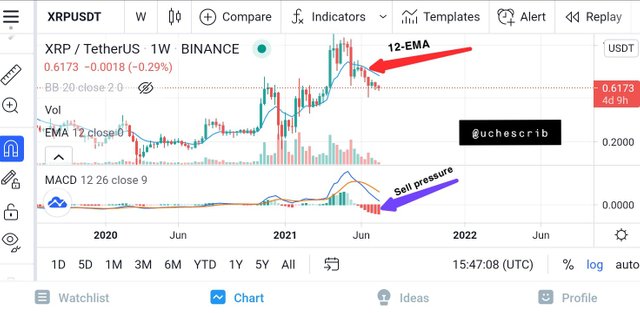
7-day Analysis on XRP
In this time frame, the MACD indicator is displaying sell pressure in the market. The 12-EMA crossed the price chart some candlesticks back. This implies that XRP is currently in a downtrend.
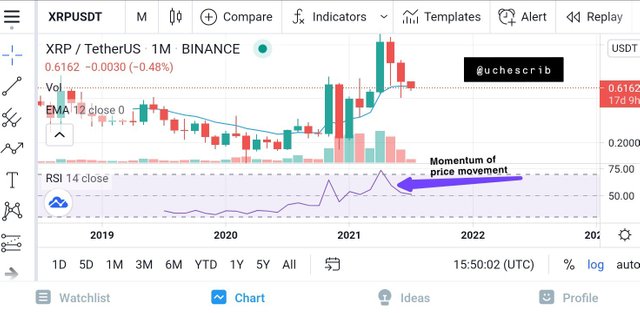
30-day Analysis on XRP
By looking at the chart, you can observe that XRP is currently in a downtrend. The RSI indicator showed a significant slope. As the RSI line reaches the 50 mark, the slope begins to reduce. The 50 mark is a position of reversal or breakthrough and this means that XRP price would undergo either situations.

Bullish Season
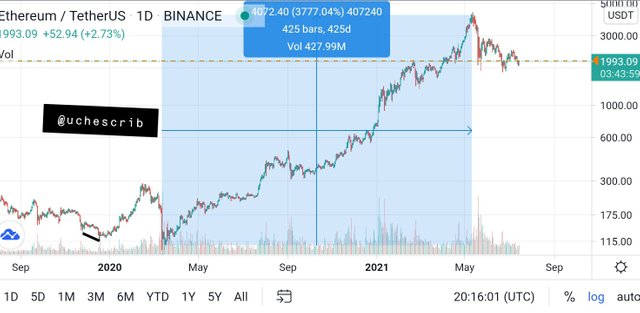
A bullish season or bullish trend is a situation where the price of an asset or commodity is increasing. A bullish season can last for as long as months or even years.
On the price chart, a bullish season is identified with zigzag lines moving upwards.

Bearish Season
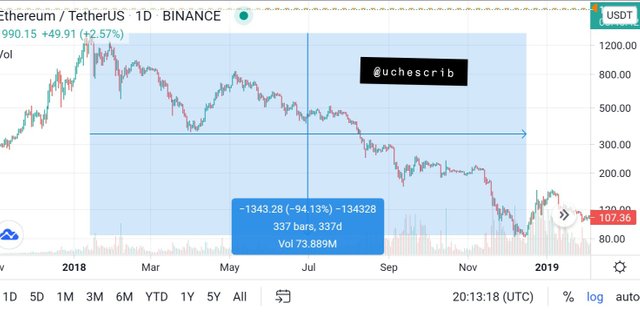
A bearish season or trend is simply the opposite of a bullish season. It is situation where the price of an asset or commodity is decreasing. Just like a bullish season, a bearish season can last for months and years.
On the price chart, a bearish season is identified with zigzag lines moving downwards.

Differences between Bullish and Bearish Seasons
| Bullish Season | Bearish Season |
|---|---|
| A bullish season is a situation where the price of an asset is increasing over a period of time | A bearish season is a situation where the price of an asset is decreasing over a period of time |
| Bullish season is characterized by higher highs and higher lows | Bearish season is characterized by lower highs and lower lows |
| This situation occurs as a result of buy pressure in the market (demand>supply) | This situation occurs because of sell pressure in the market (supply>demand) |

Conclusion
Staking is a method of making profit with cryptocurrencies without having to worry about price change.
In price forcast and trend identification, technical analysis is very important. Although these indicators cannot detect real world problems that affect price action, they are still very effective in making trade decisions.
Special thanks to @imagen.
Thank you for participating in Season 3 of the Steemit Crypto Academy.
Congratulations, you did a great job.
I look forward to continuing to correct your next assignments.
Thank you sir