Steemit Crypto Academy Season 3 - Week 3 || Introduction to technical analysis of price patterns
Hello everyone. Here is the @hibbanoor. After reading the lecture for twice, now i am enable to do my homework for professor @imagen.

.png)
Perform the staking on a platform of your choice.
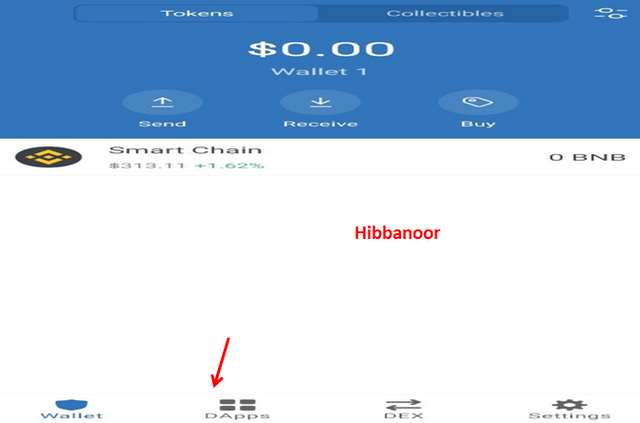
I am going to perform the staking using the Pancakeswap. It is so easy and secure platform. Moreover, i already have experienced of staking on this platform. It is good to earn reward through staking. I will use the trust wallet. Here are simple steps to follow.
1- Open your trust wallet. Click on Dapp option in the bottom
.png)
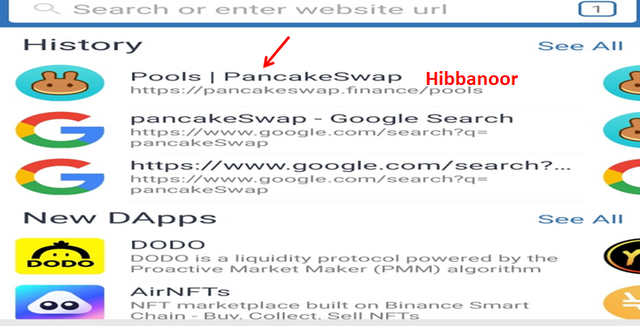
2- On next page, write the Pancakeswap or just paste the link on search bar.
.png)
Note: We did so because Pancakeswap work on Binance smart chain. Click on Ethereum sign and select the smart chain from dropdown list if you have not set your network to binance smart chain.
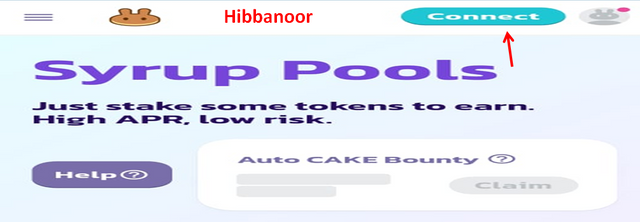
4- There will be a button on the top named as "Connect". Click that.
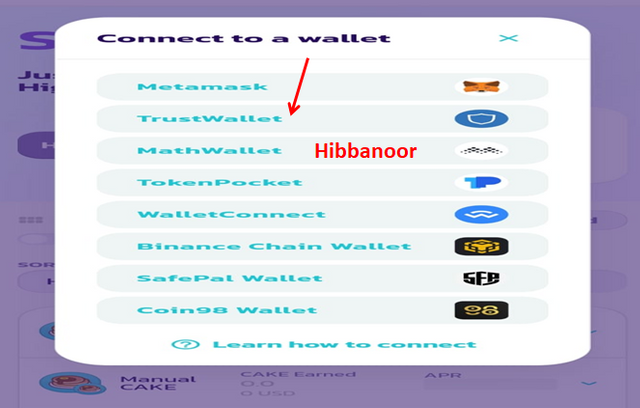
5- A list of wallet will be shown. Select wallet of your own choice. I select Trust wallet.
.png)
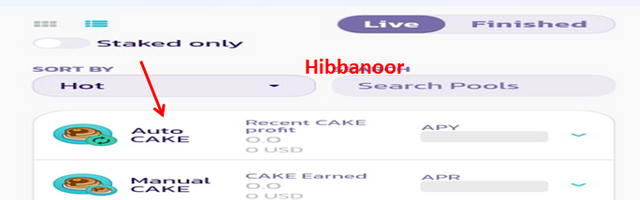
6- Click on the three lines shown on the top right corner. A drop down list will be appeared. Select pool from there. A new page will be appeared.
.png)
7- Select pool. I choose the first one Autocake.
.png)
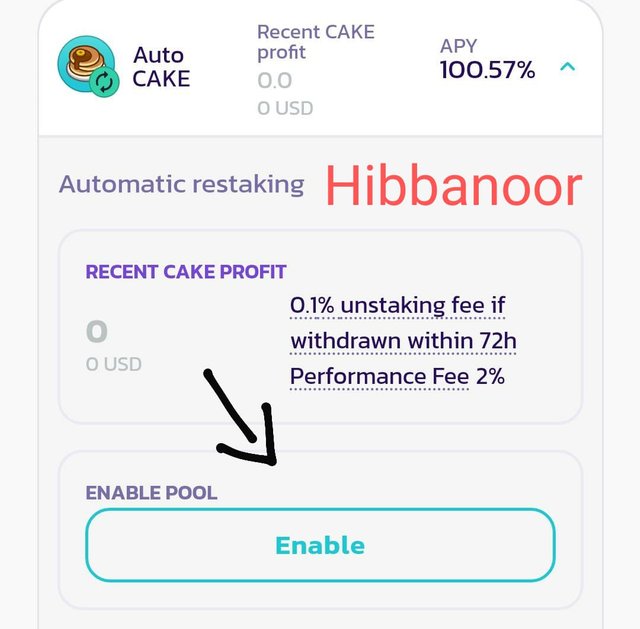
8- Click on Enable.
.jpeg)
9- After that, just click on Stake option in next page and then confirm your staking by clicking on Confirm button.
.png)
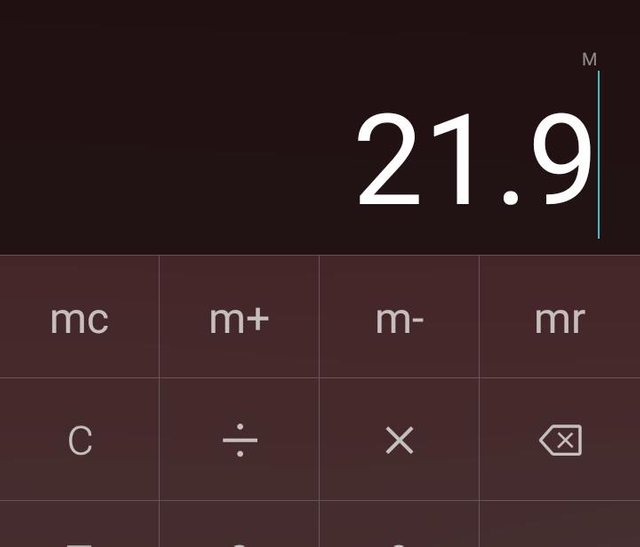
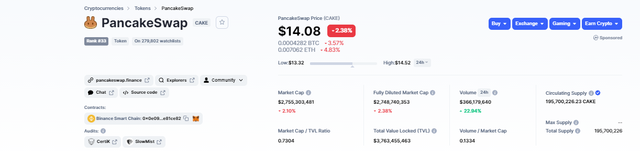
The ARY is 100.57%. My cakes mine 0.06%. So total cake i will earn will be 365 x 0.06= 21.9 Cake.
.jpeg)
The current cake price is 14.08$.
.png)
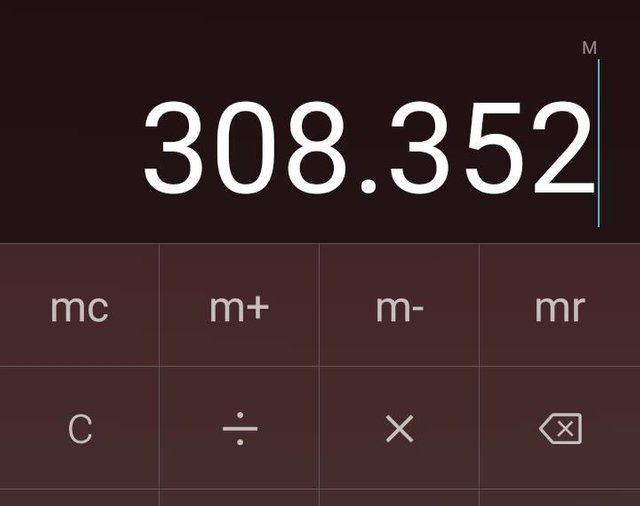
So total earning throughout the year will be. 14.08 x 21.9= 308.352$.
Question 2- Pick 3 cryptocurrencies and perform a 7-day and 30-day technical analysis. Draw trend lines and describe whether the coins are in a continuation or reversal pattern. Take screenshots.
.png)
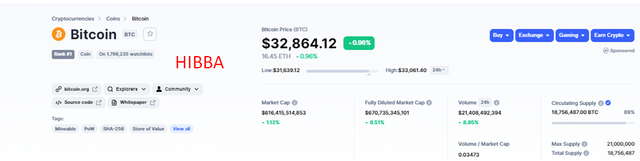
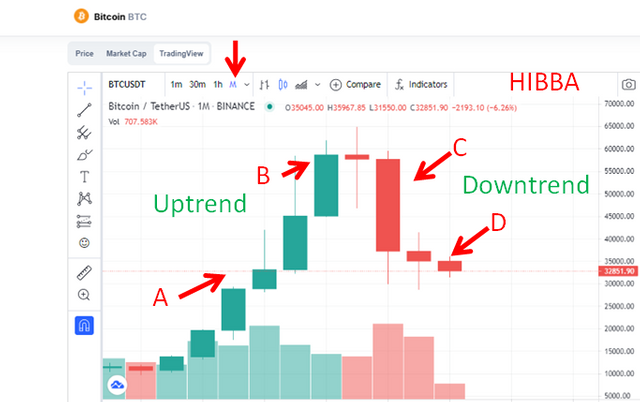
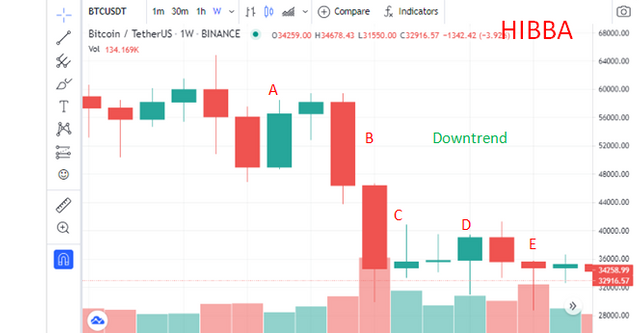
Bitcoin is the world largest and first crypto currency.
.png)
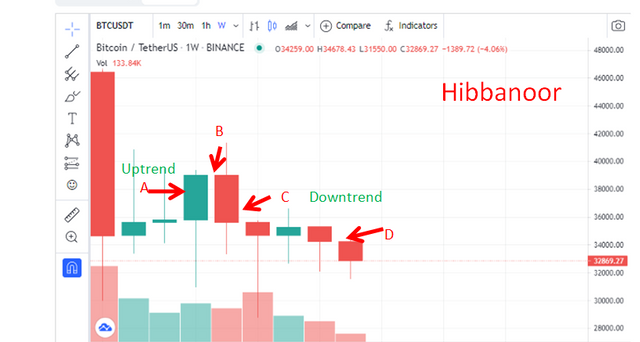
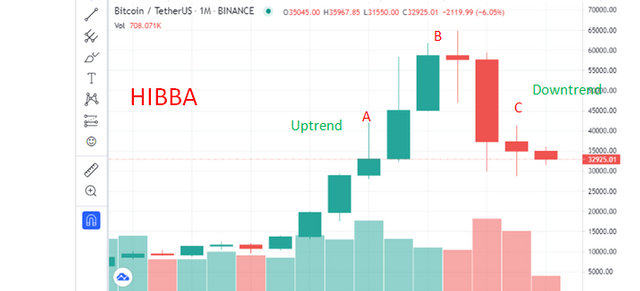
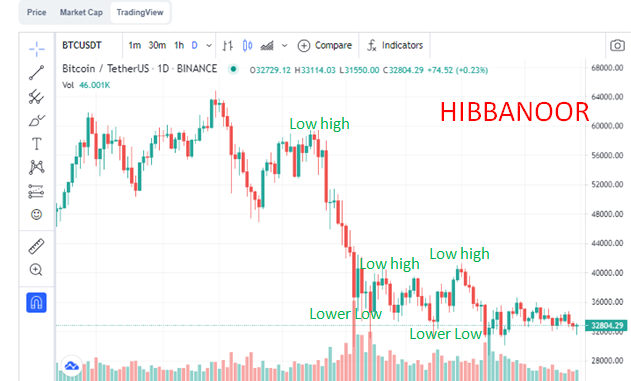
The above is the 7 day chart of Bitcoin. The price was increasing at Point A. After that, they people started selling the coins can earned profit. Then downtrend started because of selling assets at point B. The price started falling. There is a continuous increase in price between point A and B. After that downtrend started and only a slighter increment in price was seen in downtrend. That was a lower high spot. Then again price decreases in point D. The MArket currently is at downtrend. It is a good time to buy the coins because the price of coin is low.
.png)
The above is 30 days chart of bitcoin. Here there was a continous uptrend between point A to B. The price continously rises. Then the people sold their assets and downtrend started. A continous downtrend is observed between point C and D.
.png)
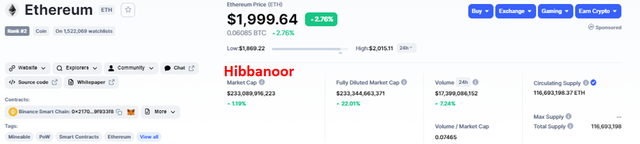
The ethereum is second largest crypto currency.
.png)
.png)
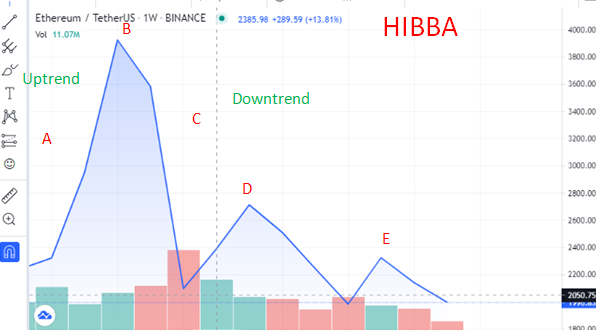
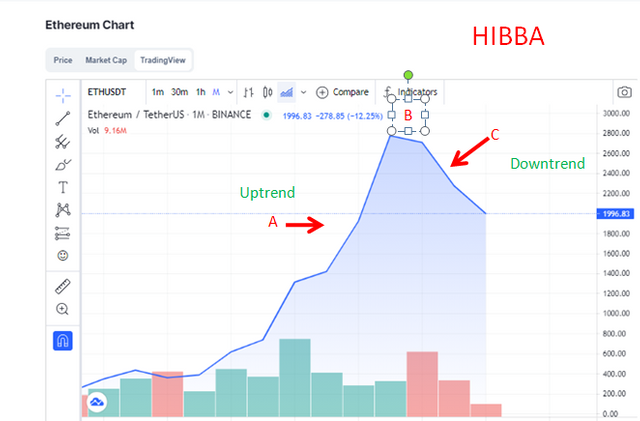
The above chart shown that there was a continous increment in price from point A to B. Then downtrend started and price started falling. The price fell continously between point B and C. Then a lower high point came, price started rice but again the fall occured and price decreased . Now market is at its downtrend.
.png)
.png)
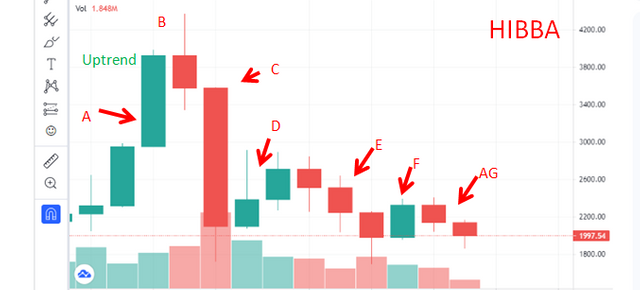
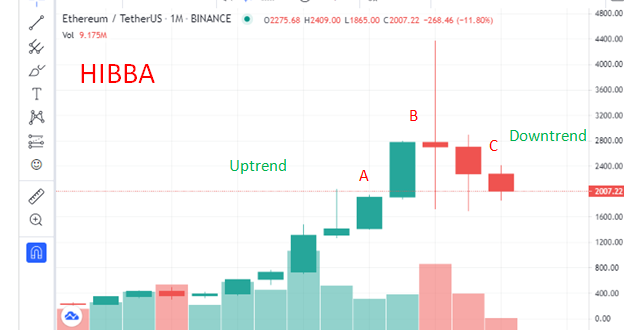
The above graph showing that there was a continuous increement in price from point A to B. Then people started selling and downtrend start. The price started falling and there was fall in price continuously from point B to C. The market is at downtrend and good spot to enter into market.
.png)
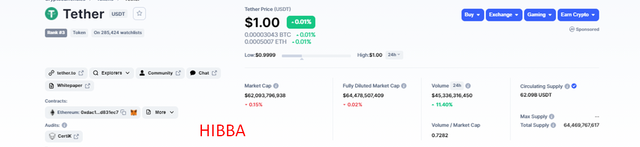
Tether is at ranked 3 in the list of crypto currencies.
.png)
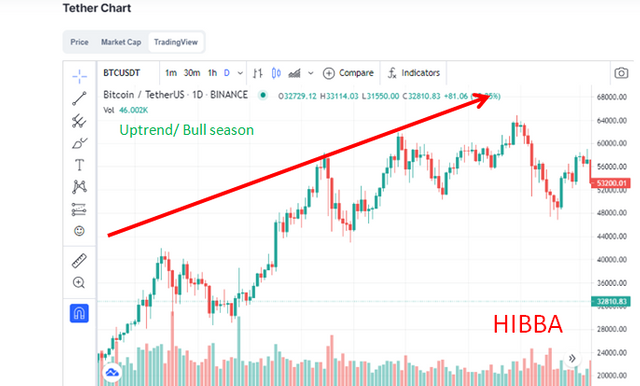
The above chart shwoing that the market was at its uptrend when the price was rising at point A. The people were investing and market was at its uptrend. The downtrend started and price started falling. There was continuous decrease in price between point B and C. Then continuous increment in price can be shown in chart between point C and D. Again price fell at point E. The market is at downtrend and good spot to enter into market.
.png)
The above chart shwoing that the market was at its uptrend when the price was rising at point A. The people were investing and market was at its uptrend. There is continous increment in price between point A and B. Then downtrend started and price started falling. There was continuous decrease in price between point B and C. The market is at downtrend and good spot to enter into market.
Question 3- How can we differentiate a bearish season from a bullish season in the market?
We know that the crypto market is highly versatile. The trend continously changes. No trend is for permanent. If it is downtrend, a time will come when the price will start rising and market start growing toward upward. Same in case of uptrend. If this is market uptrend, people will start selling their holdings to earn profit. The demand will decrease and supply will increase. The market will start moving to the downtrend.
There are basically two main trends in market. The market continuously move between these two. If price is low, the people will consider it a good chance and will buy the coins at low price. It always a good point to enter into the market. The buying ratio will start increase which rise the demand ratio. The supply will be decrease and price of coin will start moving upward. This is said to be the bullish season. The Market is at its peak point. The price is high at this point.
.png)
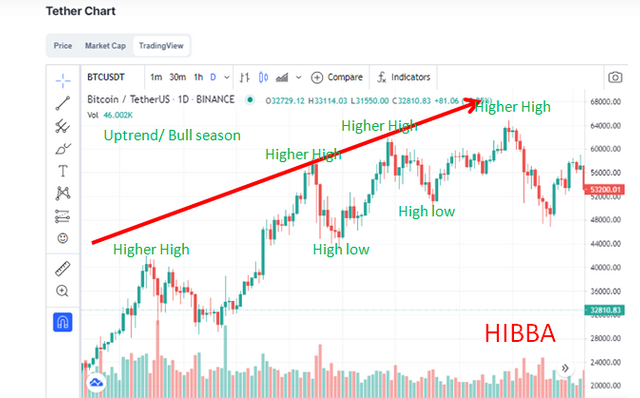
The Coin does not rise straightly. When the market is at downtrend, there was fluctuation in price. The price was continuous to rise and fall. There are some lower-low and lower-high spots. But when these lower-high spot turn into higher-high and high-low spots, the uptrend start. This happen when the price fall below the a line. There are some higher low spots while moving toward upward.
.png)
When the higher high spot start turning into lower high spots, the downtrend start. When the price reach to the peak, the people started selling the coins. The sell their holding and earn profit. The price of coin is high in uptrend. SO people consider it a good spot to exit the market.
The selling ratio will start increase which decrease the demand ratio. The supply will be increase and price of coin will start moving downward. This is said to be the bearish season. The Market is moving downward point. The price is low at this point.
.png)
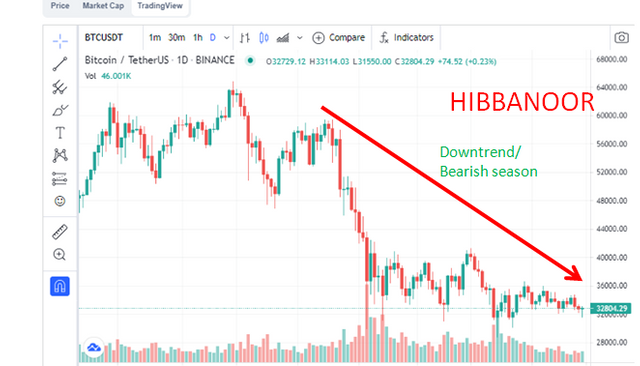
The market does not fall in straight line. When the market is at uptrend, there was fluctuation in price. The price was continuous to rise and fall. There are some high-low and higher-high spots. But when these higher-high spot turn into lower-high spots, the downtrend start. This happen when the price fall below the a specific point/ line. There are some lower high spots while moving downward.
.png)
Conclusion
Staking is an easy and secure way of earning in crypto world. You do not need to invest the money, just stake them and earn the income for that.
The technical analysis is best way to predict the market future. It is an easiest way to understand where the market is moving. The investors make important decisions after predicting the market future through technical analysis.
The market continuous to move to upward or downward. The trend keep changing. No trend is for permanent. Sometime there is bearish season and sometime the market is at bullish season.
I am thankful to the professor @imagen
Hello professor @imagen. I post this homework for second time. Because first time the images was hidden because the quality was low. So i edit the pictures and add them again. Hope this time you would like it. Thanks
Nice wrote up homework .
Thank you for participating in Season 3 of the Steemit Crypto Academy.
Congratulations, you made a great effort, however, I cannot find in the screenshots that you present, the amount of staked cakes, however I deduct by the rate of 100.57%, which is an amount close to 21 cakes.
On the other hand, I suggest you use an image editor, for example, PicsArt or SnapSeed to resize the graphics to a size suitable for reading.
Continue to strive, I look forward to continuing to correct your next assignments.
Next time surely i will work more harder to fulfill your expectations.