Steemit Crypto Academy | Season 3 - Week 3 || Introduction to Technical Analysis of Price Patterns
Welcome to another wonderful episode in the crypto Academy. Before I present my homework post, I would like to acknowledge the professors and the crypto Academy community for making such an educative lecture possible. Today's Topic is quite interesting Introduction to technical analysis.
Without wasting enough time I would present my homework post systematically based on the questions from the professor @imagen.
Staking on Pancakeswap
Pancakeswap is a decentralized exchange platform where users trade on cryptocurrencies and tokens without any third party (Intermediary) like the Centralised platforms. Pancakeswap is built on automated smart contracts deployed on Binance Smart Chain.
How to connect pancakeswap to Trust Wallet
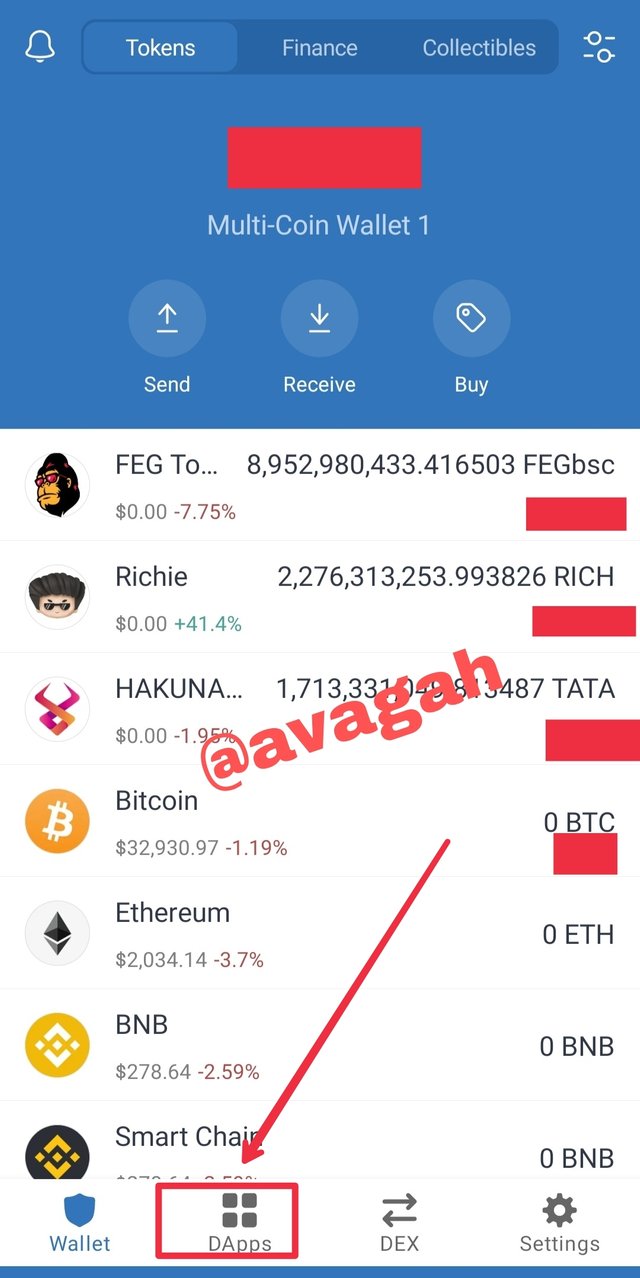
step 1
- open trust wallet and go to Dapps at the button
- click on pancakeswap as shown

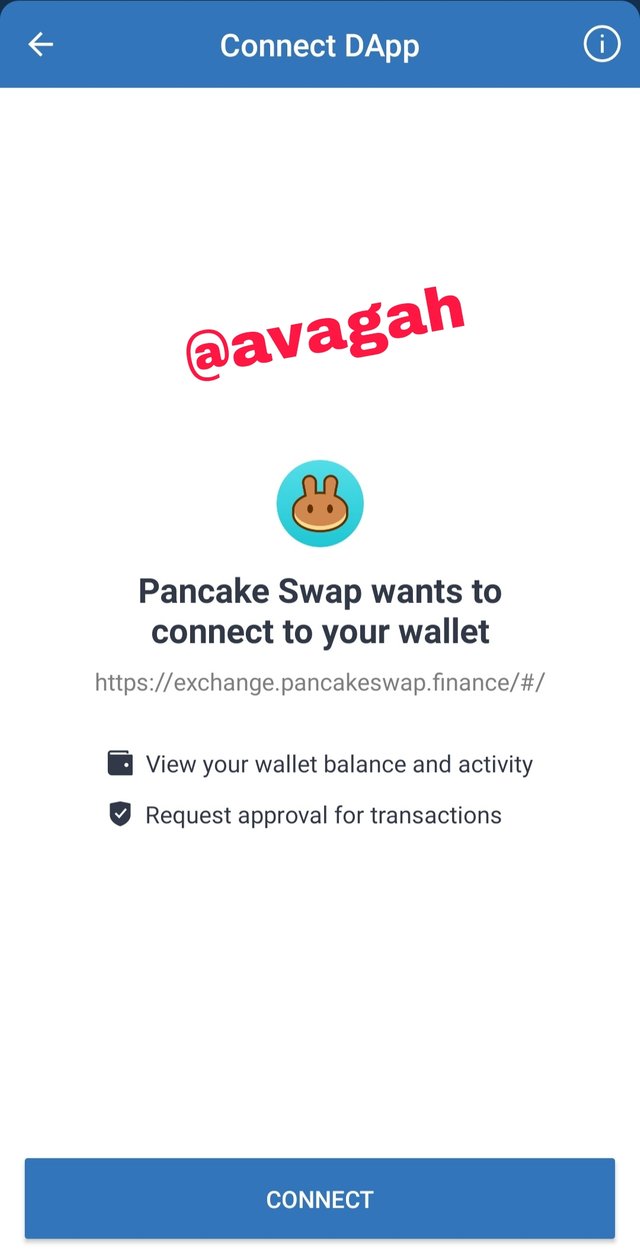
Step 2
- click connect to connect pancakeswap
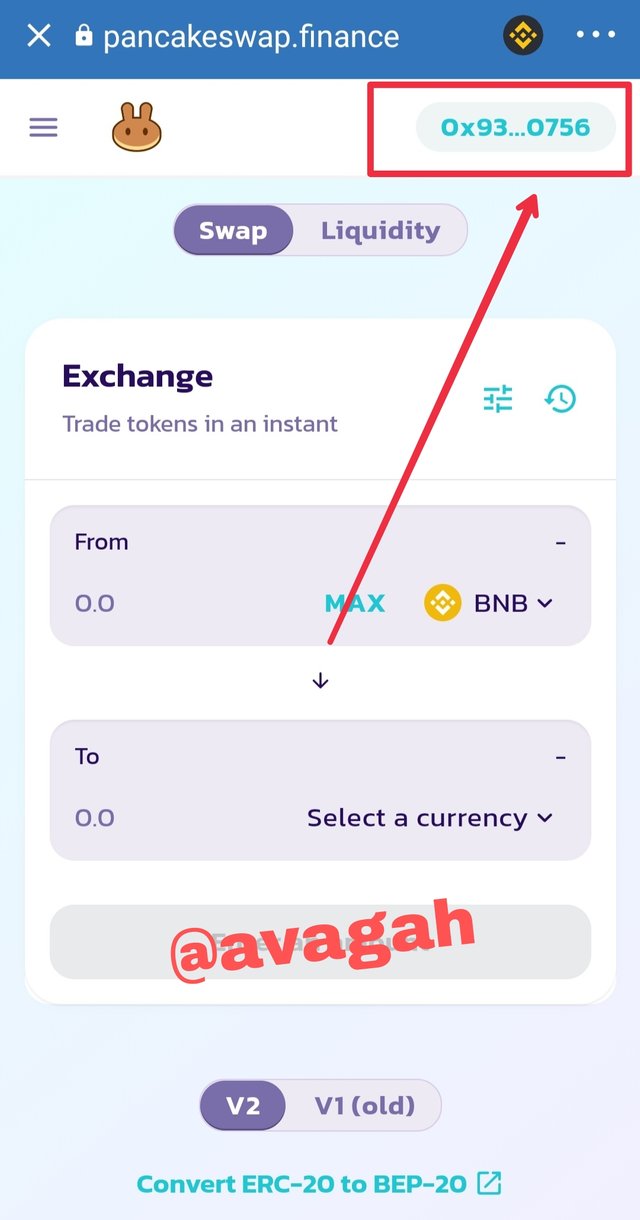
- pancakeswap would connect as showed below
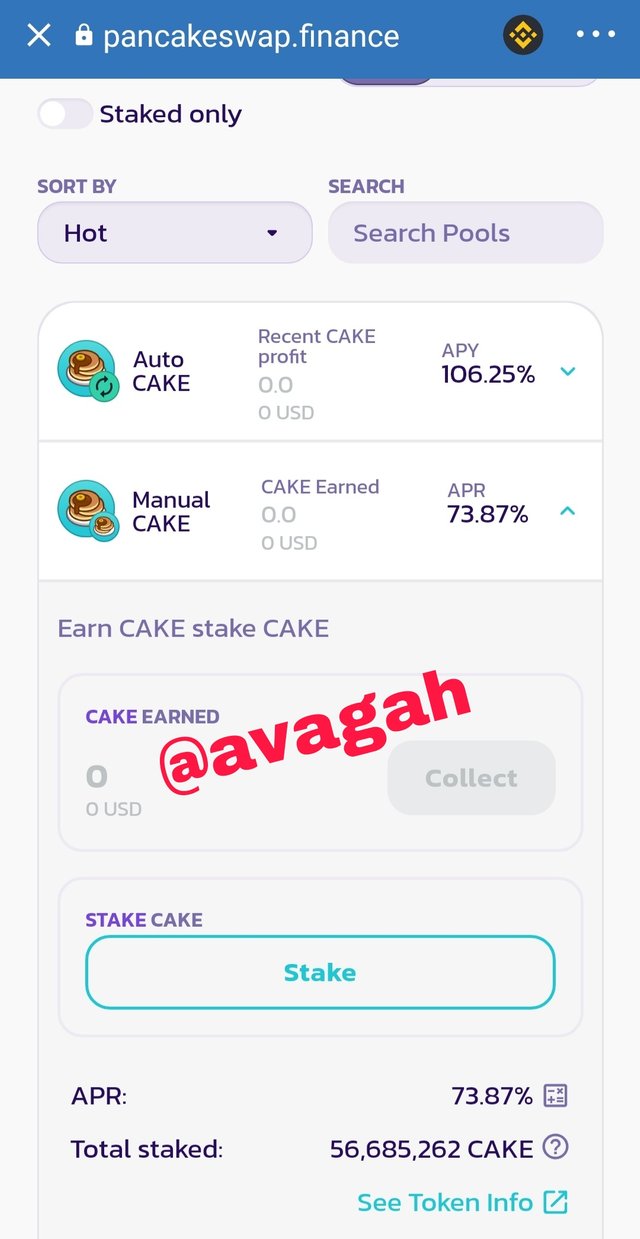
How to stake on Pancakeswap
Step 1
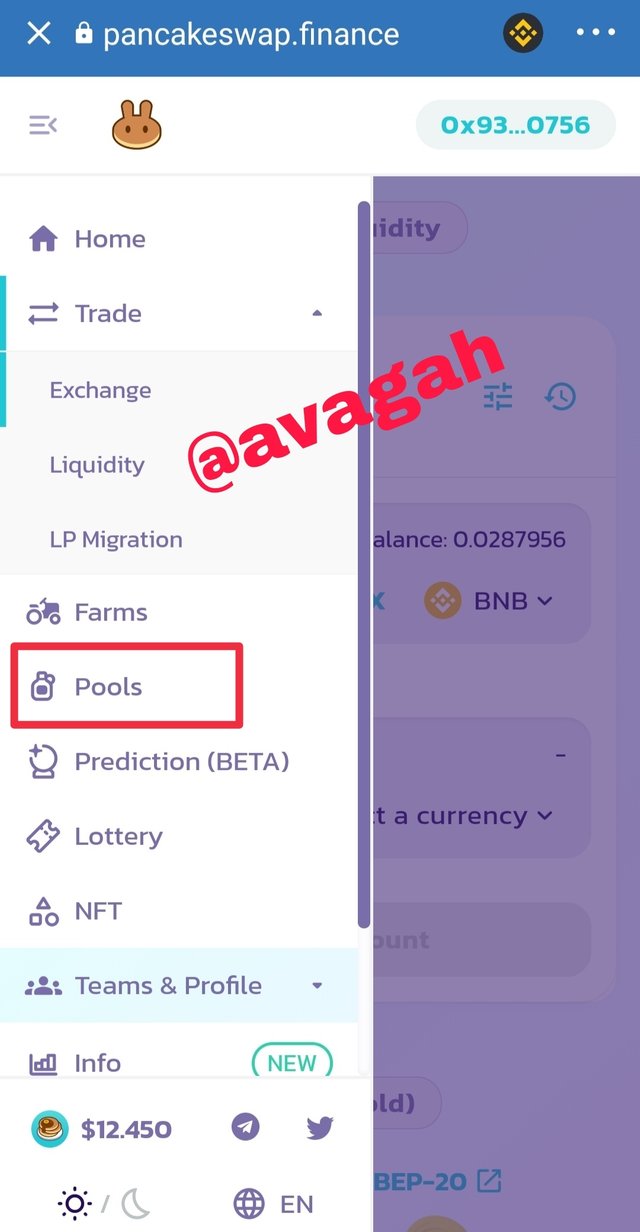
- open pancakeswap in trust wallet .
- click on pools from the drop down of the three parallel lines at the top left.
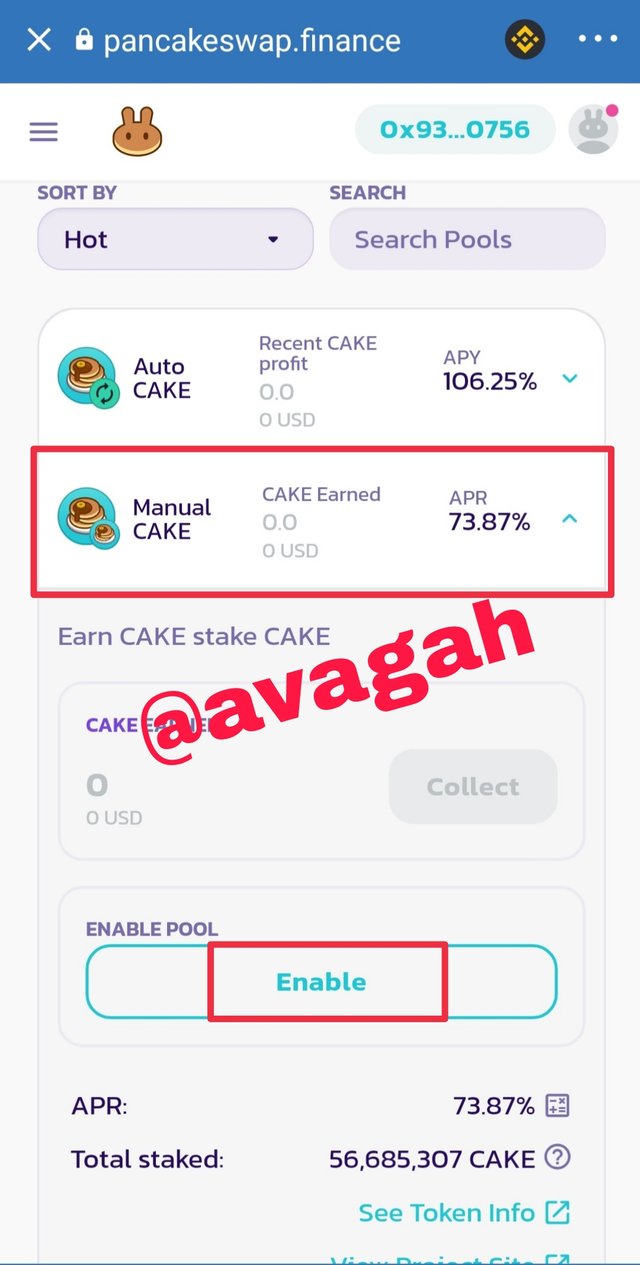
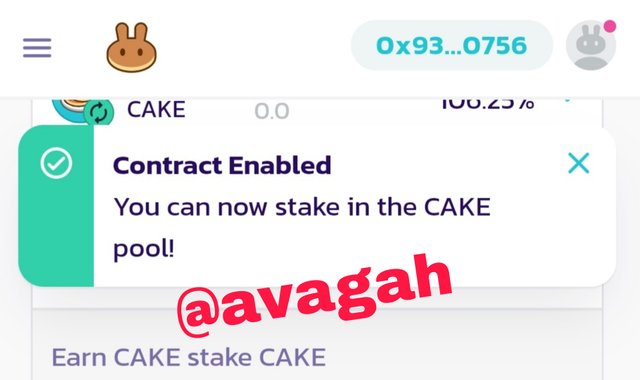
- click manual CAKE and click enable
Step 2
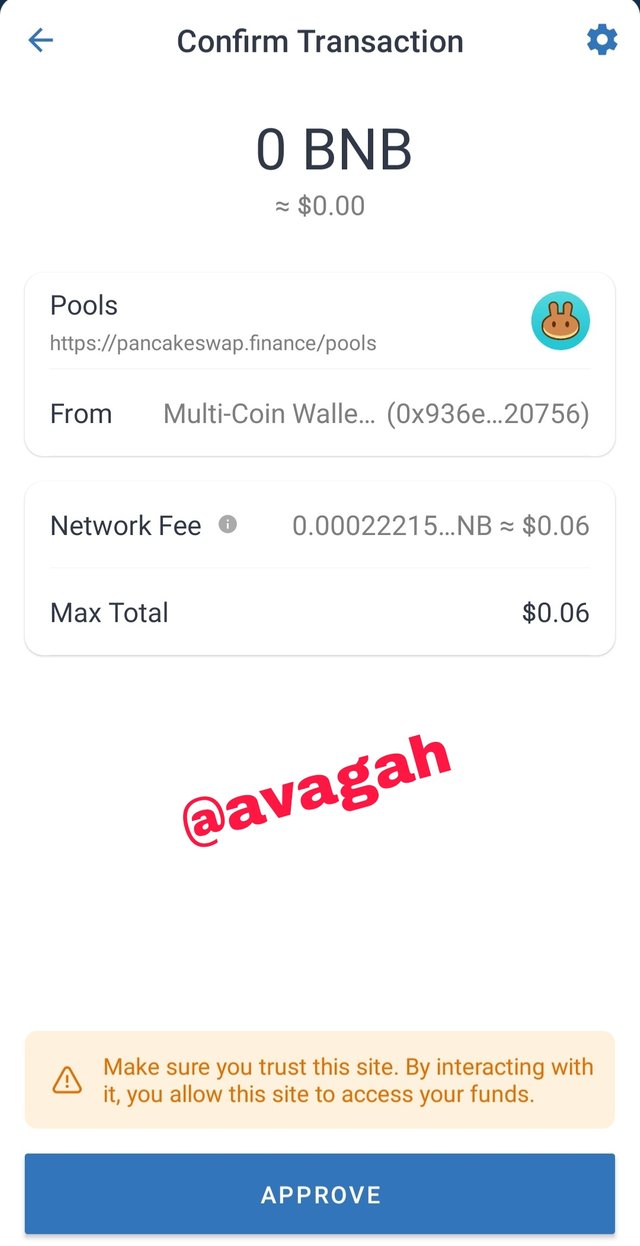
- Approve to enable
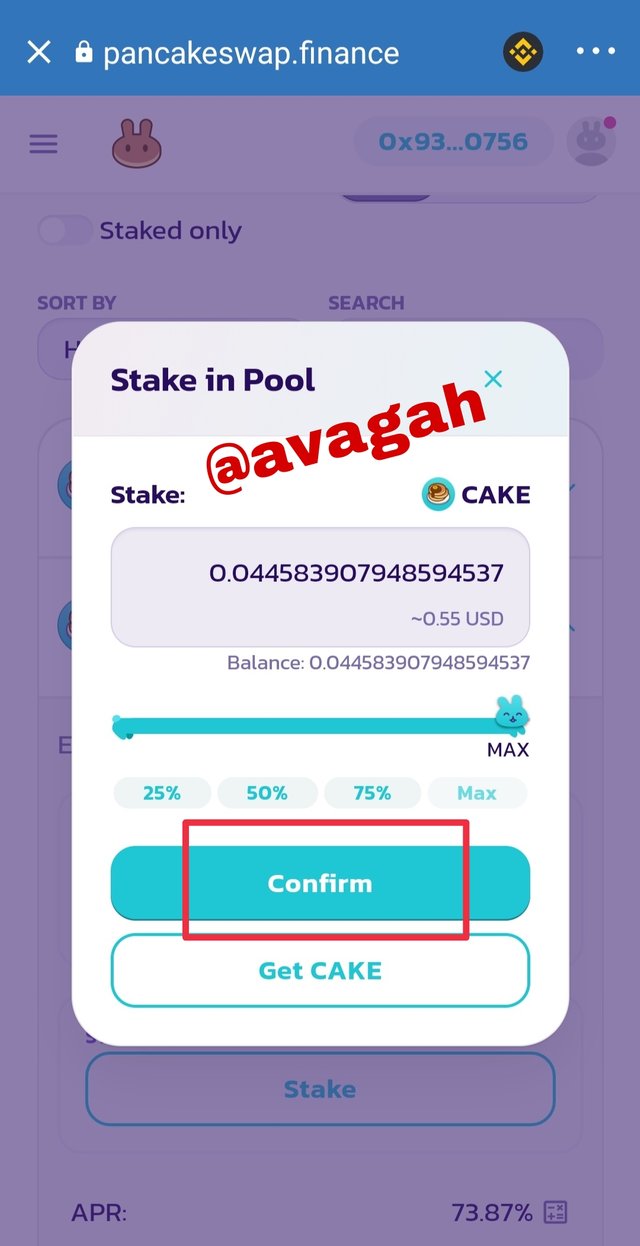
Step 3
- click stake to stake
- click the percentage to stake and click confirm for next approval
cake staked
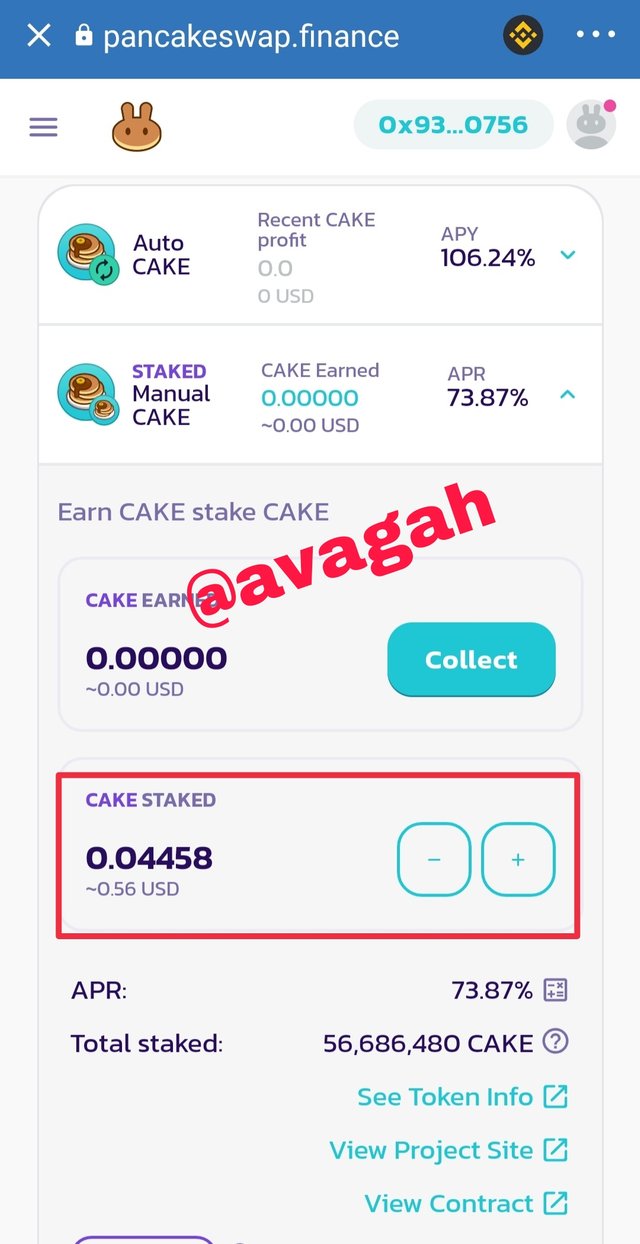
From the above staking,
- The APR is 73.87%.
- everything remaining stable,
I would receive 0.04456×12=0.534 tokens - which is equivalent to 6.72USD

Pick 3 cryptocurrencies and perform a 7-day and 30-day technical analysis. Draw trend lines and describe whether the coins are in a continuation or reversal pattern. Take screenshots.
Here I would choose:
- Bitcoin
- Steem
- Dogecoin
Bitcoin
Bitcoin 30 days chart
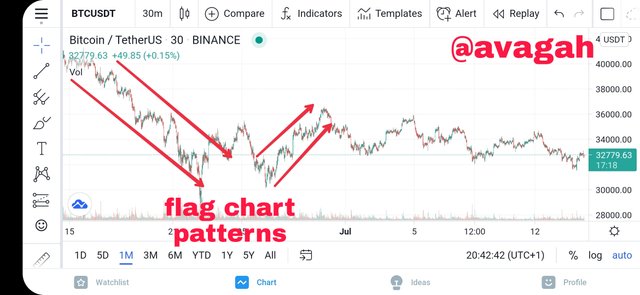
From the chart, bitcoin shows a continuous downtrend talking from the monthly chart. The highest point was at the middle days of june. Now the price has decreased from around 40k usd to around 32k usd. Showing a massive decrease over the month.
Bitcoin weekly chart
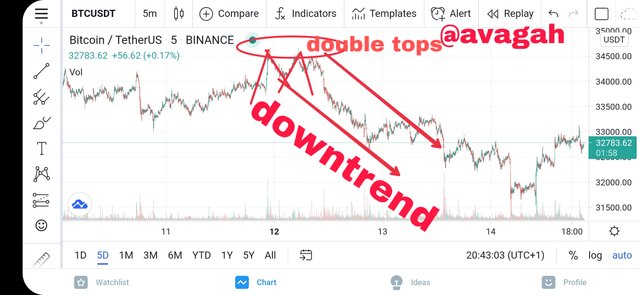
Looking from the weekly chart, the Bitcoin is also showing another downtrend. Currently Bitcoin is showing no sign of bouncing back. Its always decreasing.
Steem
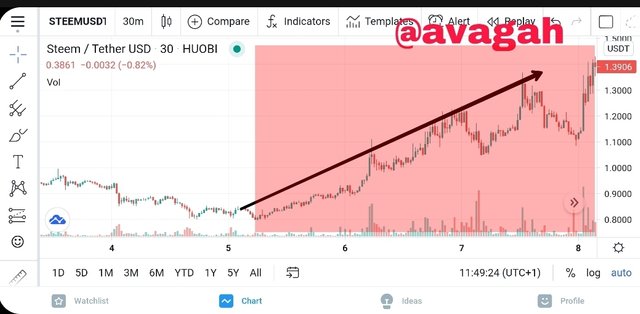
Steem 30 days chart
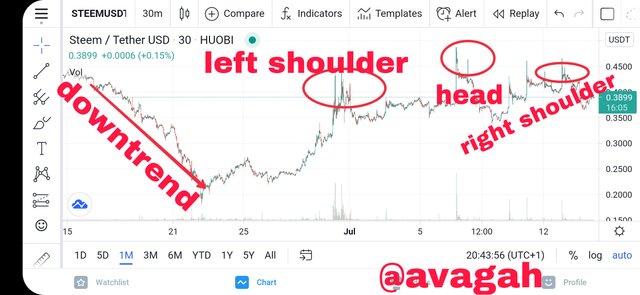
Looking at the steem monthly chart, we can see from the initial stage that steem was showing a massive downtrend. However steem is showing great signs is bouncing back. Moving from 0.2 usd to 0.45 usd is a huge change.
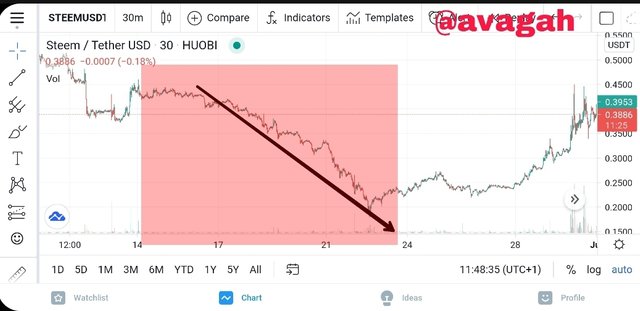
Steem 7 days chart
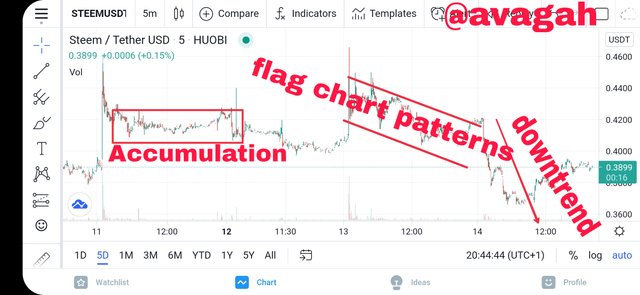
Looking at the chart patterns of the weekly steem chart , we can make assumptions that steem is consolidating or Accumulation phase since there's no significant change in the price.
Dogecoin
Dogecoin 30 days chart
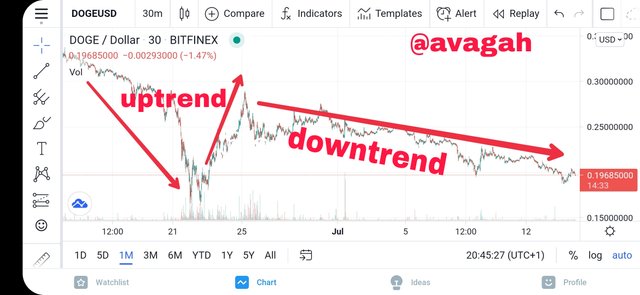
Dogecoin 30 days chart shows a continuous downtrend. Talking from the beginning of the chart to the end of the chart, there's no sign to the dogecoin increasing. However, there was a massive drop within 17th june to 21st june but the coin was able to bounce back and continue its regular downtrend.
Dogecoin 7 days chart
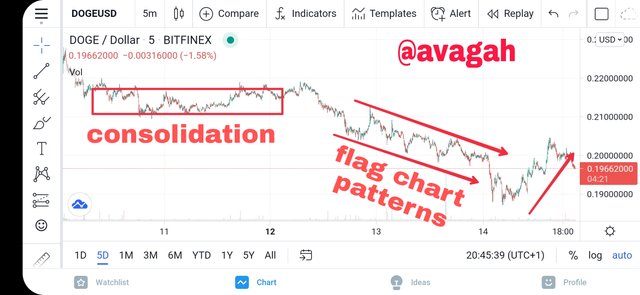
Looking from the Doge chart, the general chart show consolidation since there's no significant change in the price. From 13th July to 14th July also shows flag chart patterns since there's uptrends, downtrends (sideways).
How can we differentiate a bearish season from a bullish season in the market?
Bullish Season
The Bullish Season generally refers to the period in the stock market where the prices of the assets shows continuous uptrend. During this period, the pressure on the demand of the asset rises massively which pushes the price of the assest to rise.
Bearish Season
With the bearish season, the chart of the assets shows continuous downtrend. During this period the supply of the asset in circulation becomes more dominant than the demand which forces the price of the asset to decrease continuously. Holders also begin to panic within this season and they end up selling all thier holdings which push the price down.
Conclusion
To conclude, I would say technical analysis the a very relevant tool in the stock market. Knowing the meanings of the various trend lines could help you to make decisions whether to buy,sell or hold.
Thank you for participating in Season 3 of the Steemit Crypto Academy.
Congratulations, you made a great effort, however, the correct calculation of the amount at the end of 1 year of 0.04458 staked cakes is: 0.04458 x (1 + 0.7387) = 0.07751 cakes, which multiplied by the value in the token market, gives you its equivalent in USD.
I look forward to continuing to correct your next assignments.
Thanks for the corrections