Bitcoin analysis What has Bitcoin in common with parabolic curves (#21)
My friend @futuristgear ask an interesting question in replay on my comment in one of his analysis posts. It is about RSI oscillator indicator. RSI is a momentum oscillator that measures the speed and change of price movements. RSI oscillates between zero and 100. If RSI is approaching its upper bound the market is in overbought state and if it approaching the lower bound the market is in oversold condition. If market is overbought, demand for particular asset is high. Everybody wants to buy it but nobody is selling this asset. The opposite is true in oversold market. Demand is low there is plenty of asset for sale but nobody have intention to buy it. Price of particular asset is related to demand. If I may be colorful: high demand (scarce stuff) - high price, low demand (plenty of stuff) - low price.
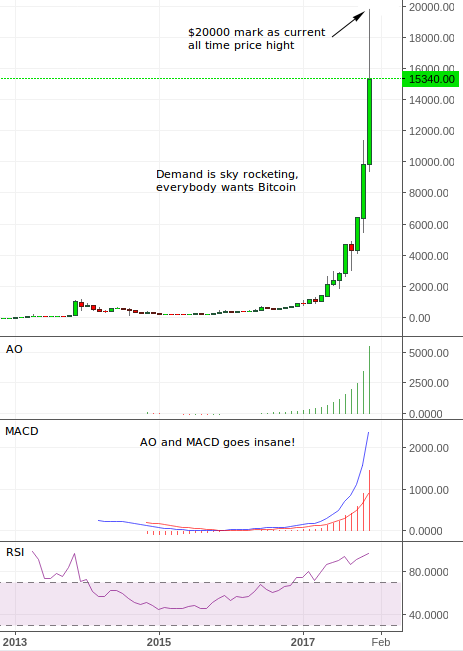
In the chart above, which is pretty weird there is a tell of high demand for Bitcoin. Everybody wants it, but just a few has privilege to have it. From year 2013 this demand is sky rocketing. As result of this giant demand price goes up in parabolic curve. It has reach $20000 mark as current all time price height.
Such high demand is caused by something. This something has lot in common with psychology of masses and new technology promising tectonic changes in our society. First time in history mankind have a technology to share trusted information among parties which don't trust each other without any intermediaries. We can exchange tokens on to peer to peer basis over the blockchain and be completely sure that nobody can counterfeit or misuse this transaction.
This is a solution of Byzantine general problem. Four generals have to attack a city from four sides. They have to attack simultaneously if they want to succeed and conquer this city. But they have to secretly coordinate their attack. If they send runners with messages, they can be spotted, killed, intercepted or defenders of the city can hijack them and force them to deliver false messages. So nobody of four generals can trust each other to be sure to attack at the same time. If it will be possible that this generals have a messaging system on the blockchain, they will be able to coordinate themselves and can be 100% sure to take the city.
Solution of this problem have a great impact in game theory and theory of networks This two theories enable us to build completely new flat distributed structures which one day will replace governments, banks, states and all hierarchical structures in our society.
With this told, return to the upper picture and answer a question why this bubble like price chart disrupt classical economists. They see a bubble in it because demand is so high for no particular reason. They think that demand is backed by thin air and sooner or later this bubble will burst. RSI oscillator reading is 96, which is almost maximal value. Safety valve is whistling and they are saying: "It will blow up!". But I stand that this demand is backed with ability to transact information safely over the blockchains ans this ability lead to revolution which will transform our society and make this world much better.
So @futuristgear, it will be pullbacks. Big pullbacks as we already experience. But don't worry! Just transformation will not go smoothly. Every time some bump on the road will shatter the blockchain carriage pullback will strike. We will repair the carriage and continue. As the road will become more smoother few crashes will happen and eventually we will enjoy smooth ride to the bright future.
So my Bitcoiners HODL and show no fear.
----------------
Previous analysis: #14, #15, #16, #17, #18, #19, #20. Is good to check them out to get insight into my reasoning.
Image sources: Investing.com,
Data sources: Bitfinex exchange
Disclaimer: If you use my ideas and analyses in your investment ventures, you take all responsibility and consequences about your actions.
What do you think about BTC price? Comment and present your views! Great ideas emerge from good quality discussion! I'll be immensely grateful for your contribution.
And as always upvote this post and previous ones, if it have some value,follow me, if you think this content is great and I promise that it will be more interesting stuff in the future.
Let steem on, to the bright future!


i think will stay in canal price for a while !!!
Yeah in my previous analysis I define point E in my chart. If price descent bellow that point it will probably go even lower. If not it will be as you think!
Be save trade well!
I think that it is going to chill and range for a while and we still have some more diversion to shake out in the 3d and weekly charts. The 1 day may turn the corner but I see the 12hr dying out and likely we will test 13000 once more (snap shooting) not an analysis..
I was a climber also when was younger and I know when you are in the middle of your climbing route, rests to get together physically and emotionally in crucial.
Bitcoin has climb very high already, now is putting together for the next climb section, another rope length, another standing post ... this is climbing all about.
I can see that. I see it bouncing back and forth for a bit being silly first