Bitcoin analysis To the end of this year side wise movement (#20)

After significant retracement Bitcoin price start to move side wise. We have downtrend direction and predictions in this situation is have to give.
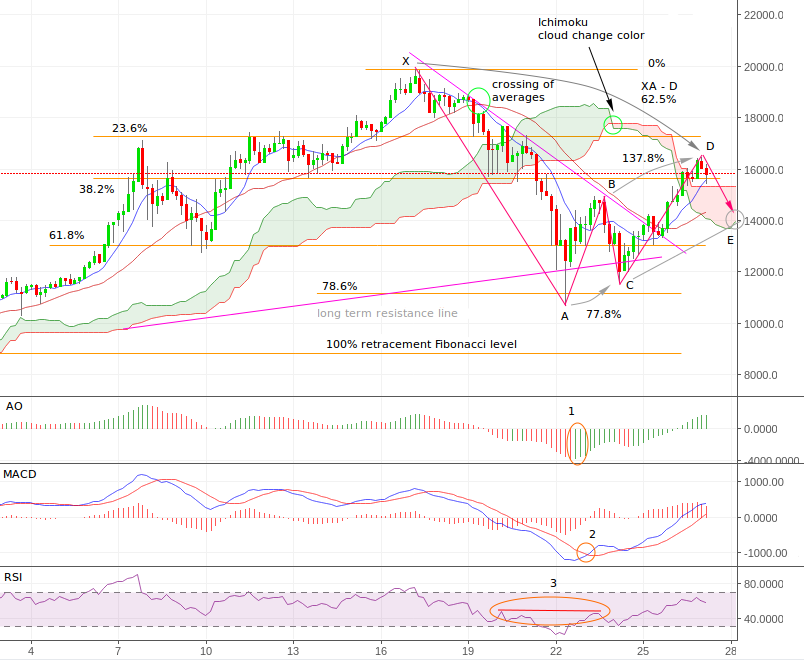
4 hours frame chart, time zone UTC - 5.
In my previous analysis #19 I predict that price will retrace to $10.5k levels, but instead of that Bitcoin price goes side wise. It has been obvious that from all time height two weeks ago downtrend have formed. First we have a crossing of averages then price descent through Ichimoku cloud and then Ichimoku cloud change color. This three events are clear and very reliable sign of trend reversing. For me Ichimoku cloud indicator is most reliable trend indicator and save me a lot of troubles.
So what i miss out in my previous analysis that my prediction was incorrect and price not dive more to my predicted target. In technical analysis intuition what is important and will affect price most is always decisive. Maybe I was to excited with sound analysis of @futuristgear suggested in his post ABC correction pattern and missed some important clues from my chart telling me, that so strong downwards move is not so likely.
Mistakes are our greatest teachers. So let's analyse my three flaws I missed. First, awesome oscillator AO was well bellow the center line indicating possible upwards momentum. Second, I completely missed MACD lines crossing, indicating trend reversal. Third, RSI oscillator was in divergence with price. And on the end price descended way bellow Ichimoku cloud and it is in tendency to rise. From all this I should conclude that so sharp descend of price I suggested in my previous analysis is very unlikely and as you see it had not happened.
I spot some interesting pattern on chart. After big downwards move (XA) a ABCD upwards correction have occurred. Combination of big swing in one direction and correction in another is classical setup to start trade in big move (XA) trend direction. ABCD move have almost perfect Fibonacci proportions AB-C = 77.8% ~ 78.6% retracement and BC -D = 137.8% which is between 127.2% and 161.8% extension. This proportions are typical for ABCD pattern which predict price movement in BC (downtrend in our case) movement.
If price will descent to the point E, I'm pretty sure that downtrend will continue, if that condition will be meet.
In the last times as you can spot on Steemit some whales witch hunting and bulling had been conducted. I write a post about that and invite all visitors of this post to constructively and objectively discuss about that.
Check link here.
----------------
Previous analysis: #13, #14, #15, #16, #17, #18, #19. Is good to check them out to get insight into my reasoning.
Some contemplation in the next post Bitcoin goes parabolic.
Image sources: Investing.com,
Data sources: Bitfinex exchange
Disclaimer: If you use my ideas and analyses in your investment ventures, you take all responsibility and consequences about your actions.What do you think about BTC price? Comment and present your views! Great ideas emerge from good quality discussion! I'll be immensely grateful for your contribution.
And as always upvote this post and previous ones, if it have some value,follow me, if you think this content is great and I promise that it will be more interesting stuff in the future.
Let steem on, to the bright future!
Keep up the updates...many of us are just fish looking for a school to connect with...thanks...any other coins you follow?
It is demand to follow some other ones. If the time allows me I will gladly write also about BitShares, EOS, other classical alts (ETH, DASH,LTC)....
Be in touch and fallow my posts, it will be my pleasure to share my blogs with you.
solid analysis as always..