Bitcoin Correction Prediction - How Did I Do? (Part 2)
Correction Over? I Got It Wrong!
It seems my first attempt at using a combination of Elliott Wave theory and some more basic Technical Analysis indicators wasn't enough to help me correctly predict where the bitcoin correction may take us.
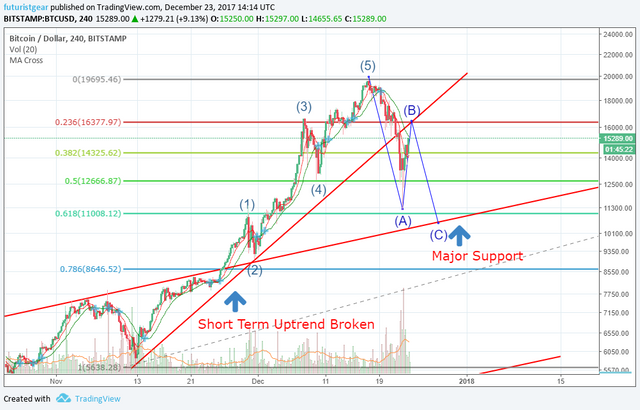
Here is my original guesstimate of where I expected the ABC correction to end up:
I was close at predicting where the "B" would land, as we can see here:
But that appears to be about it.
No Big Deal!
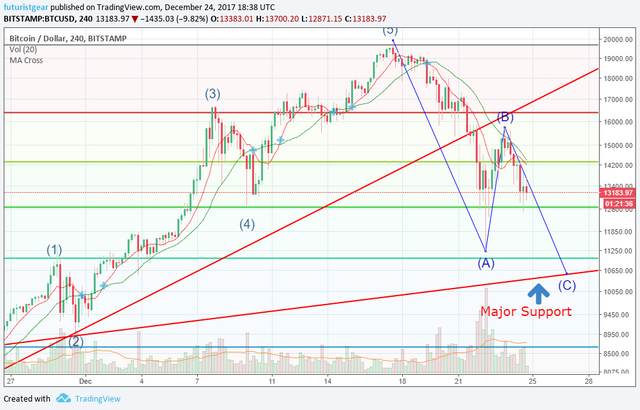
As we can see from an updated chart, my target for the "C" of the ABC correction wasn't even close:
On the plus side, things are looking very bullish once again! We have:
- A golden cross on the MA (the little blue "+" symbol)
- An RSI level above the 50 reading
- A Bullish MACD, and most importantly...
- We have broken the down trend!
All signs are currently saying we're heading higher, and that maybe this correction is in fact over.
For Now?
I still think we're in need of a larger correction - I make my case for that here - but as this interesting post from @whd shows, maybe not?
What do you think? Let me know down below.


Love it! 🤣
I also miss a point in my analysis. Check here why I think correction is very likely.
I appreciate @futuristgear you are correct and comment your analysis if it missing something.
We're both still learning, I'm sure I have missed things and will do so in future too! :-)
I agree with you about a correction, I still think a larger correction is coming because of this, but let me know what you think about that?
I notice you are using some different tools too! I haven't learnt about the AO and Ichimoku cloud yet, I see quite a lot of people using that so I better read up on it.
Thanks for your comment @tombort!
I rethink chart you mention me in your comment. I put an answer in my post because this deserve a new post to explain my view.
Check here: Bitcoin goes parabolic #21.
Hi @futuristgear I really like your chart and I think you probably didn't account for the head shoulder pattern that was in play at around 12 500,-$(the neck) and shoulder top (17 500,-$).
If you like checkt out my chart as well I was trading the same setup.
https://steemit.com/bitcoin/@masterthematrix/bitcoin-btc-this-chart-is-a-masterpiece-of-technical-analysis-trade-update-2-12-26-17
Thank you very much @masterthematrix!
I did mention the H&S pattern in a previous post (here). It was @toofasteddie who brought that to my attention. :-)
Will check your post out for sure bud!
That 0.618 fib level and the support at the $13,000 level though.
It does look as if we could see another run at the $20,000 handle and a new ath.
Yep they held up well, there's a double bottom in there too so it's not surprising we saw the trend reverse.
I think we could too! :-)