HISTORY DOESN'T REPEAT. Does it?
"History never repeats itself, but it does rhyme"*
This post is dedicated to @tradergurl, whose skepticryptocal** attitude continues to inspire me.
Today I hope to finally put to rest the "bubble" theory (again!). I aim to do that by presenting an argument that opposes something I read earlier today. That something was this:
It's like all the gullible idiots who think the increase in crypto from 5 years ago is going to happen again and everyone is going to make it rich. It was a new tech, it bubbled then burst. If you weren't on that train when it left the station then too bad, you missed it.
From this post
Regular readers of mine may know that the above quote can not be correct because it violates Bit Brain's First Law of Crypto: "The crypto market is inherently buoyant and will continue upwards unless acted upon by continuous external forces that lower market value." (First seen in this post.)
Disclaimer: tradergurl's post was a really good post. I agree wholeheartedly with over 95% of it. I gave it my $0.00 value upvote at 100% strength. It's well worth a read.
History doesn't repeat. Does it?
History may not repeat itself but it does rhyme, and every gloss by a deconstructionist need not be a loss, pushing us further into an abyss of scepticism and indeterminacy.
~ Joseph Anthony Wittreich
I do not believe there was a "bubble". At least not one big one. I hereby formulate Bit Brain's Third Law of Crypto: "Crypto does not bubble, it's a loose chain of hype cycles." If you insist on seeing crypto as a bubble, then you must see it as a near-continuous succession of bubbles that do not impair its long-term upward growth.
The problem with a crypto chart is that it does not look like the chart of a regular commodity. I believe that it is exceedingly difficult for professionals from the world of finance and trading to understand the world of crypto. It's like trying to get a classically trained opera singer to appreciate heavy metal music. Fundamental principles are very alike in many cases, but there are some huge differences, differences that the old trading pros can't expect or account for. They simply don't fit into their framework of understanding. Continuous logarithmic growth is a good example of this.
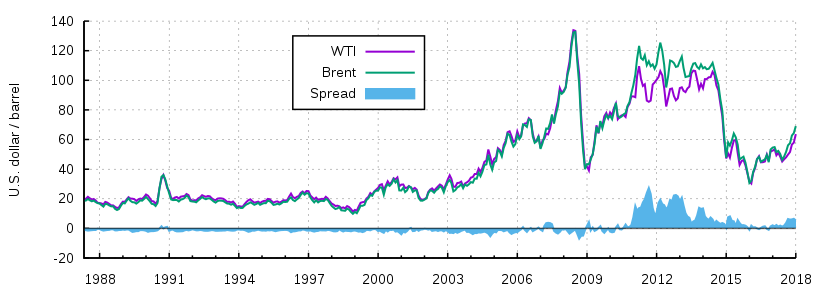
This is a normal chart.
By StefanPohl, updated by Gretarsson - Own work, CC0, https://commons.wikimedia.org/w/index.php?curid=50518908
A general uptrend (not always the case); has its ups and downs; nothing to write home about. Being WTI it's closely linked to the oil price (as shown). What you don't see are multiple "Moon shots". This is the stock market, it just doesn't happen. (I'm no pro, but I've been in traditional stocks about four times as long as what I've been in crypto, so I know a little bit about stock markets.) NOTE: This chart runs over 10 years - aeons in crypto terms.
A few stocks from the dotcom boom do behave like cryptocurrencies (Amazon is a great example). Like cryptocurrencies they were also labelled a "bubble", and like cryptocurrencies they are still rapidly growing in value. The implosion of the dotcom bubble was the death of all the little rubbish hop-on-the-bandwagon companies. The same will happen to crypto, but the overall market cap will continue to climb and the good cryptos will remain! If you buy a good, cheap, new crypto now, you could still look at possible ROI of 10000% or more within a year.
Go over to crypto with a traditional mindset and you're hamstrung from the very beginning. (I made a shitload of errors early in my crypto trading and I was hardly carrying any experience over at all.)
History never repeats itself, but the kaleidoscopic combinations of the pictured present often seem to be constructed out of the broken fragments of antique legends.
~ Mark Twain
Now look what a long term crypto chart looks like. For this post I'll be using BTC because it's fairly representative of the entire market cap (until very recently), it has the longest price history and I can use it with TradingView. Behold Bitcoin over its 5 year life of trading:

See the problem?
You can't see a damn thing! Logarithmic growth completely hides the historical price data. And that's only in FIVE years of trading! Anything over a year old is practically invisible, it might as well not even be there. To the outsider it looks like only one thing: A GREAT BIG BUBBLE!
That's a pity, because hidden in this chart is so much other information, all completely drowned out by the more recent data. THIS is why I always look at long-term (one year or more, preferably even six months or more) crypto charts in a logarithmic view. (We'll do that shortly)
Ladies and gentlemen this is NOT the first time that Bitcoin (and by extension the crypto market) has looked like a big bubble economy that just burst!
Bitcoin "bubbles" of the last 5 years
I believe that the more you know about the past, the better you are prepared for the future.
~ Theodore Roosevelt
April to July 2013
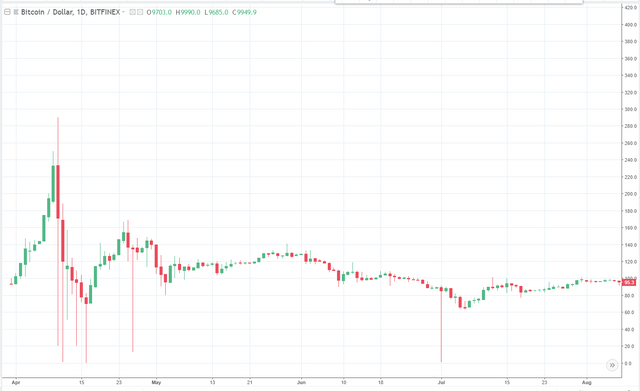 From $95 up to $290 and down to almost nothing
October 2013 to January 2015
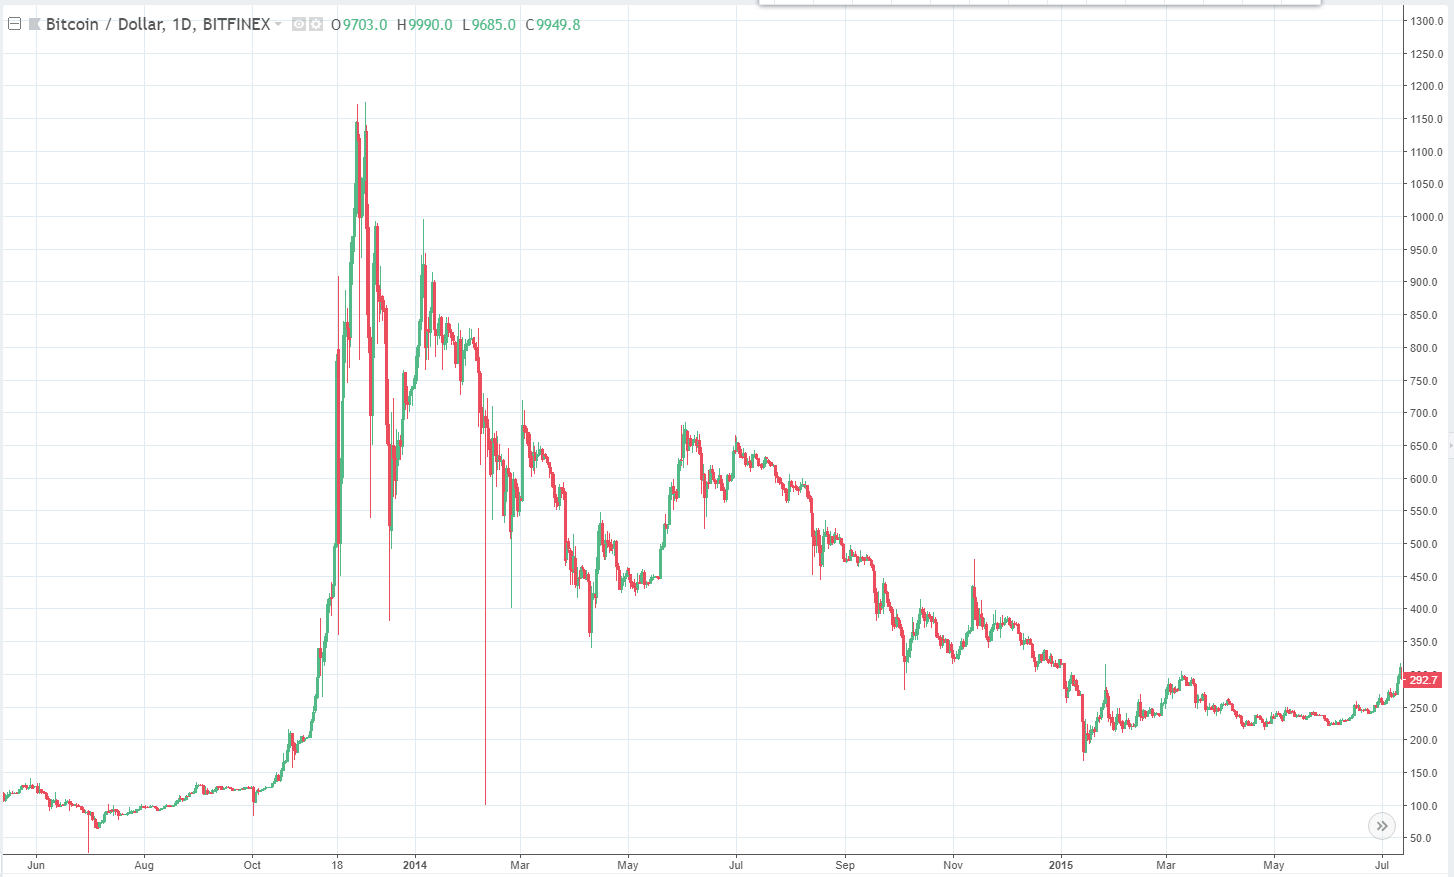 From $100 up to $1175 and down to $170
June to September 2015
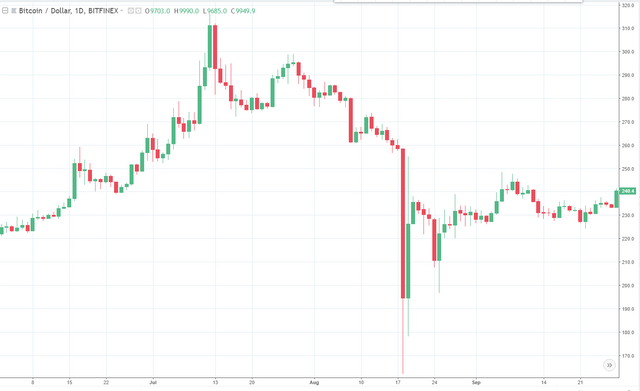 From $225 up to $315 and down to $160
September to November 2015
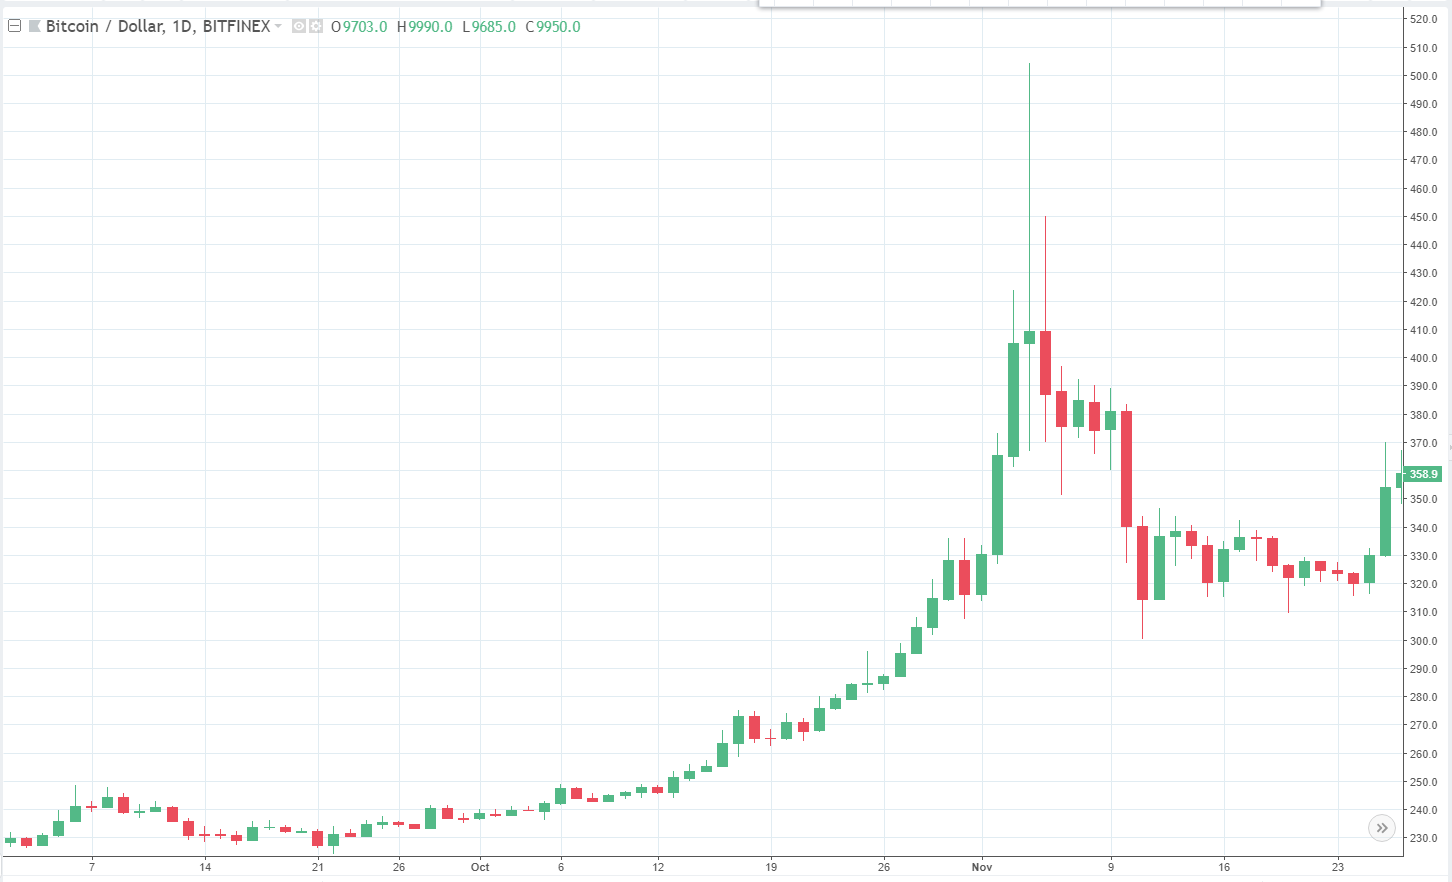 From $230 up to $500 and down to $300
April to September 2016
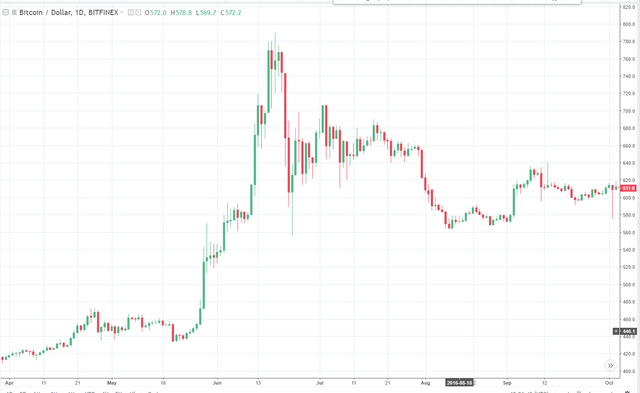 From $430 up to $790 and down to $560
November 2016 to January 2017
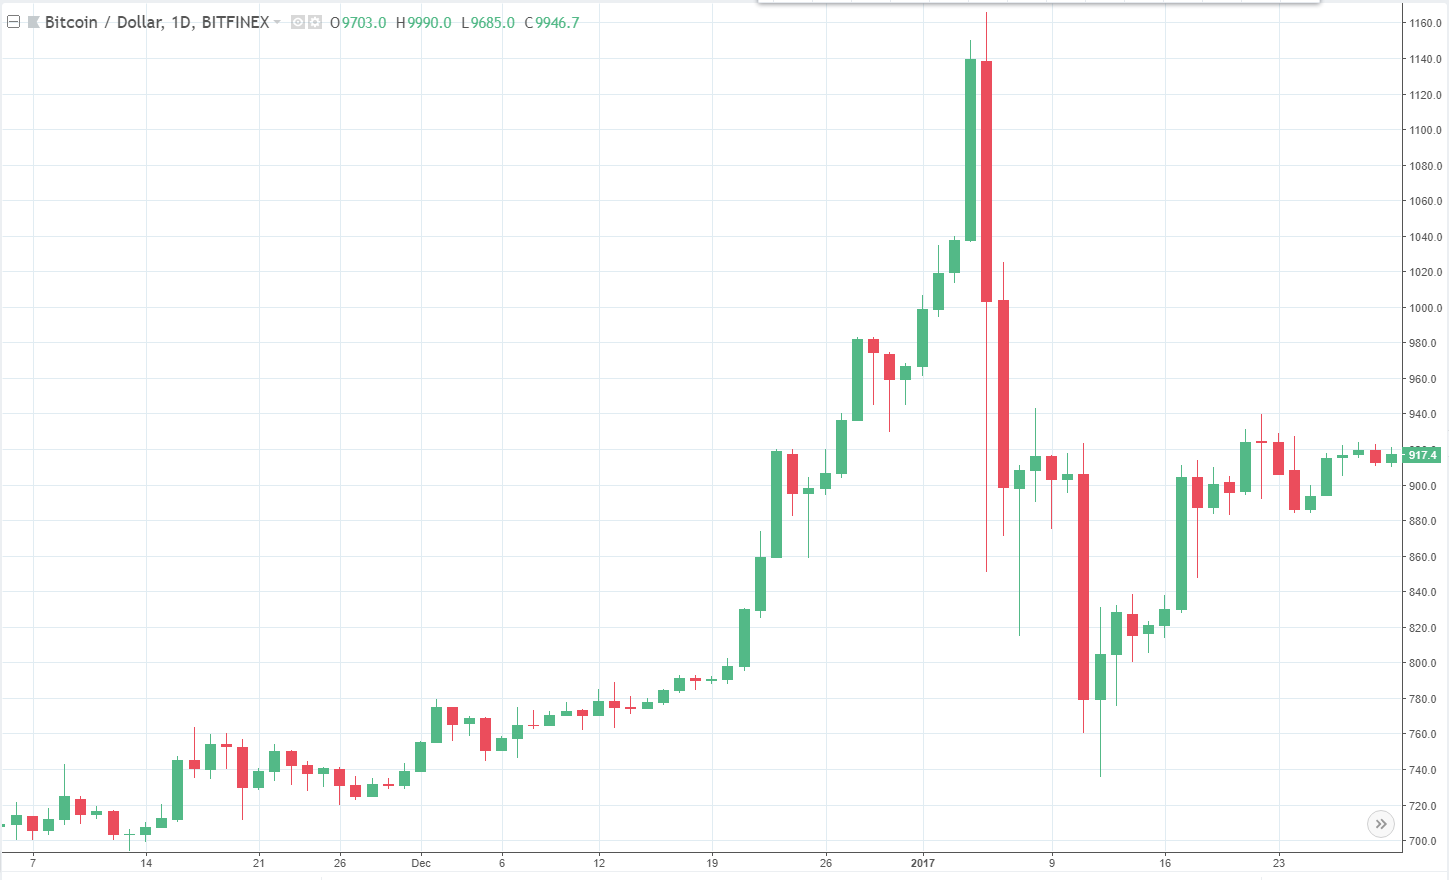 From $720 up to $1160 and down to $740
January to March 2017
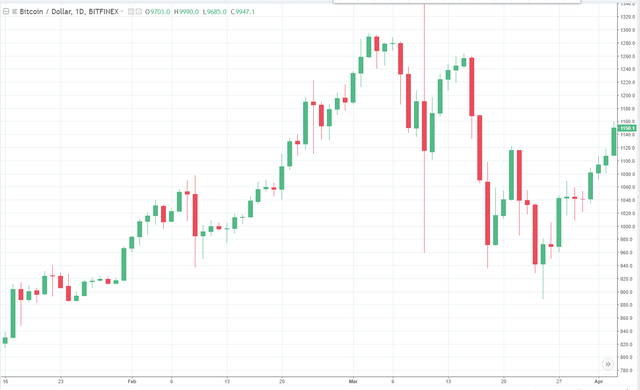 From $900 up to $1300 and down to $890
April to July 2017
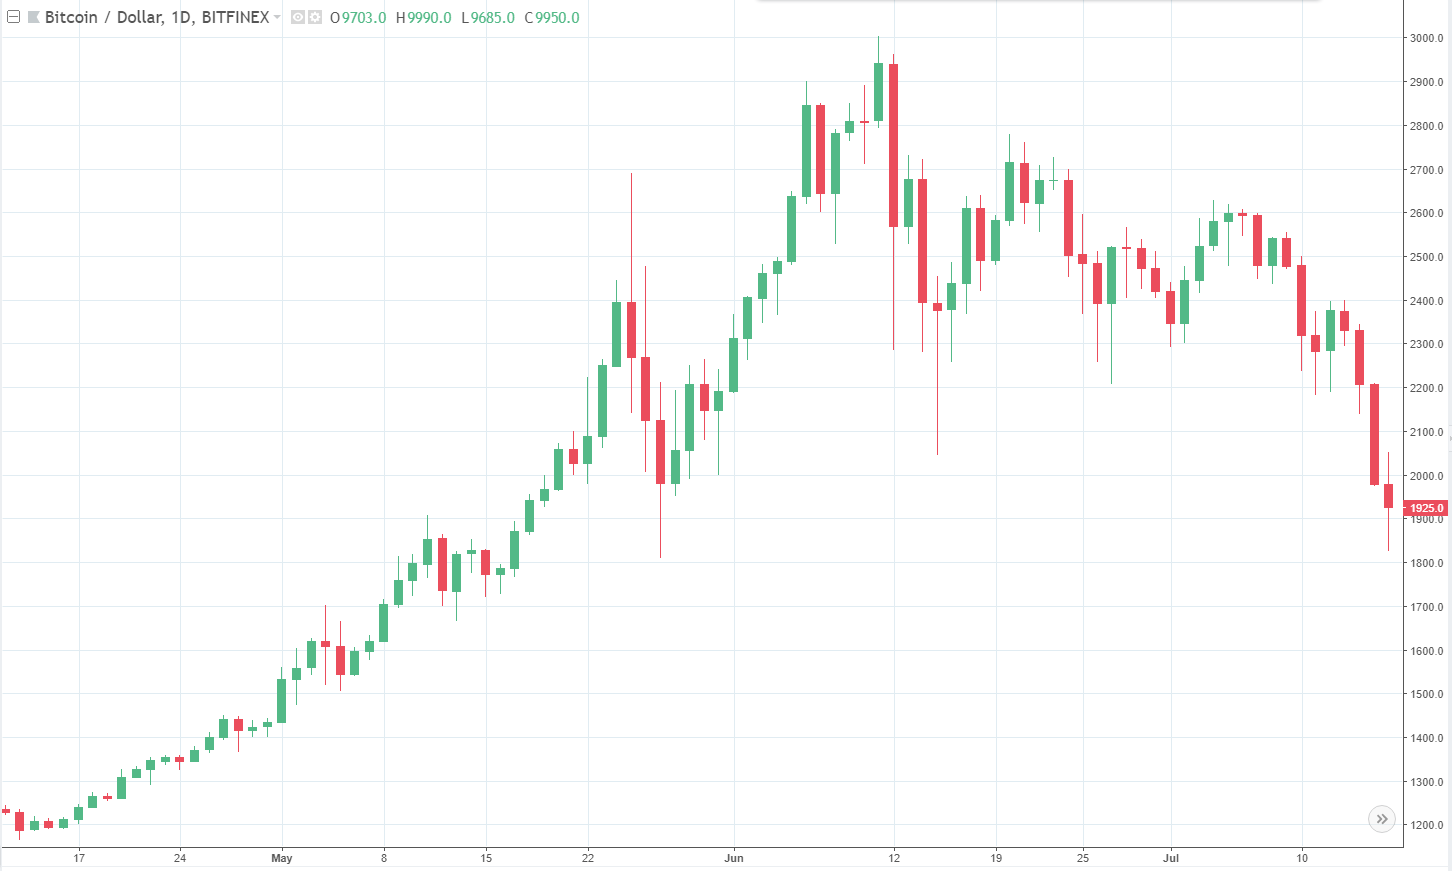 From $1200 up to $3000 and down to $1820
The above period is where I entered crypto. I caught it on the upswing, but got a rude awakening a few weeks later. I'm glad I did though, because that put me in a much better position to deal with the next cycle:
July to September 2017
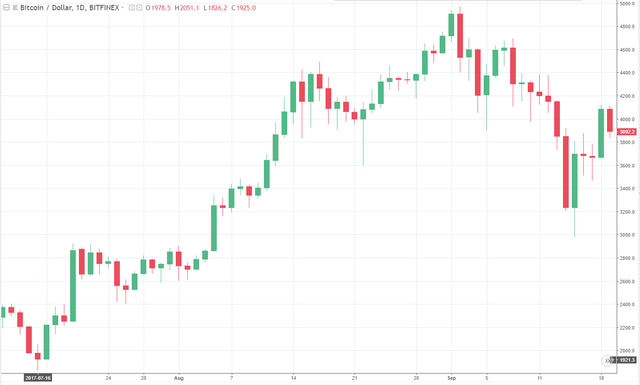
From $1950 up to $4950 and down to $3000
On 14 September my portfolio hit the lowest USD crypto value that it has ever hit since I properly invested in the market. Suddenly everyone hated Chinese regulations. It was brutal. Even at the lowest point of this recent cycle, my portfolio was still worth over four times more (in USD) than what it was on 14 September 2017. Every complaint that I've seen in the last three months, every doomsday prophecy, every "burst bubble", every "end of crypto", every "Bitcoin is dead", every "the big profits are over" - I saw it all during the China FUD. And so I was well equipped for:
November 2017 to April 2018
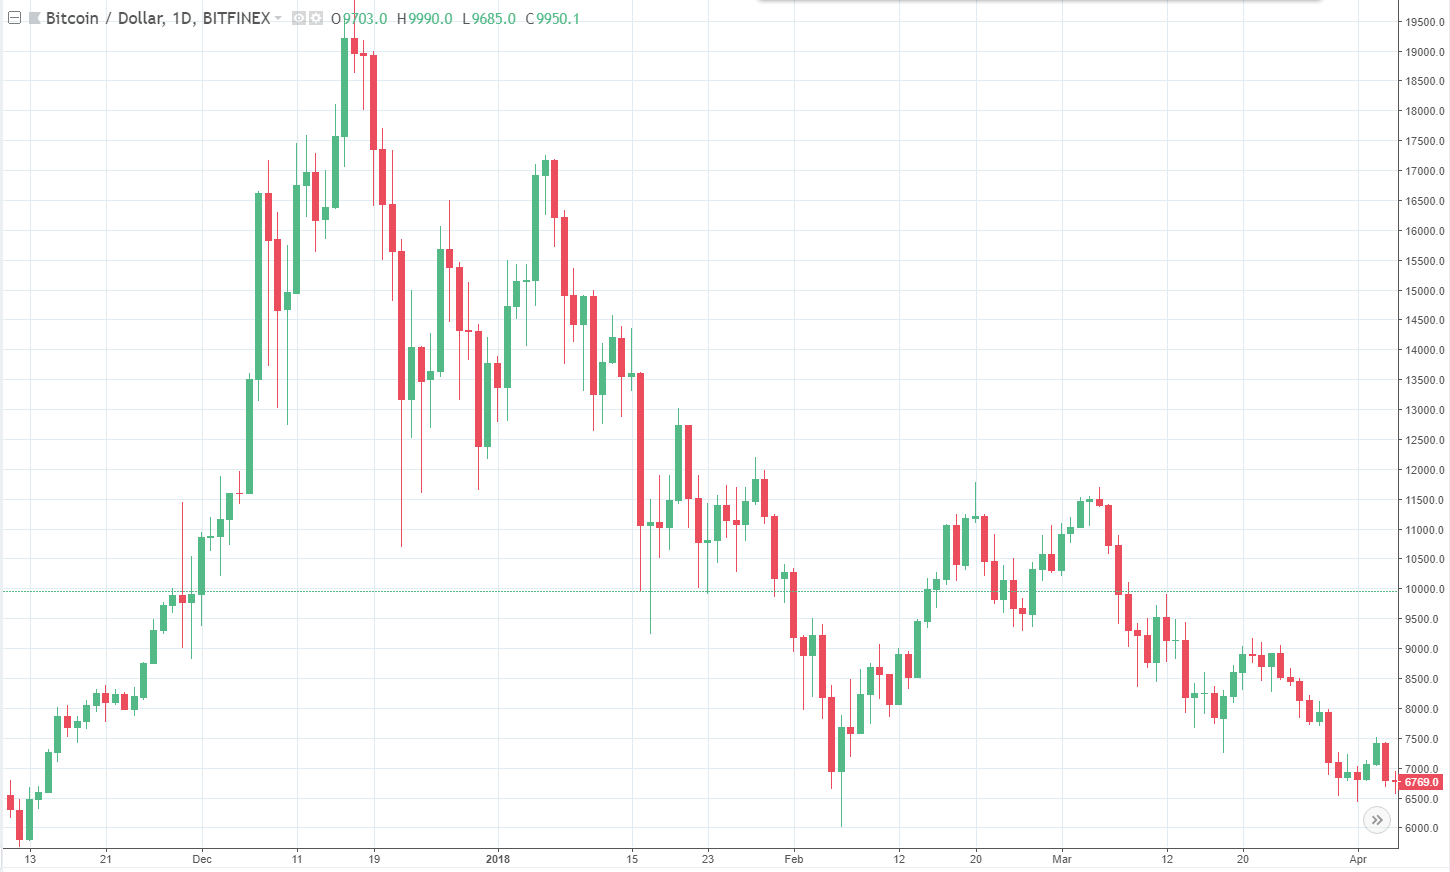 From $6000 up to $20000 and down to $6000
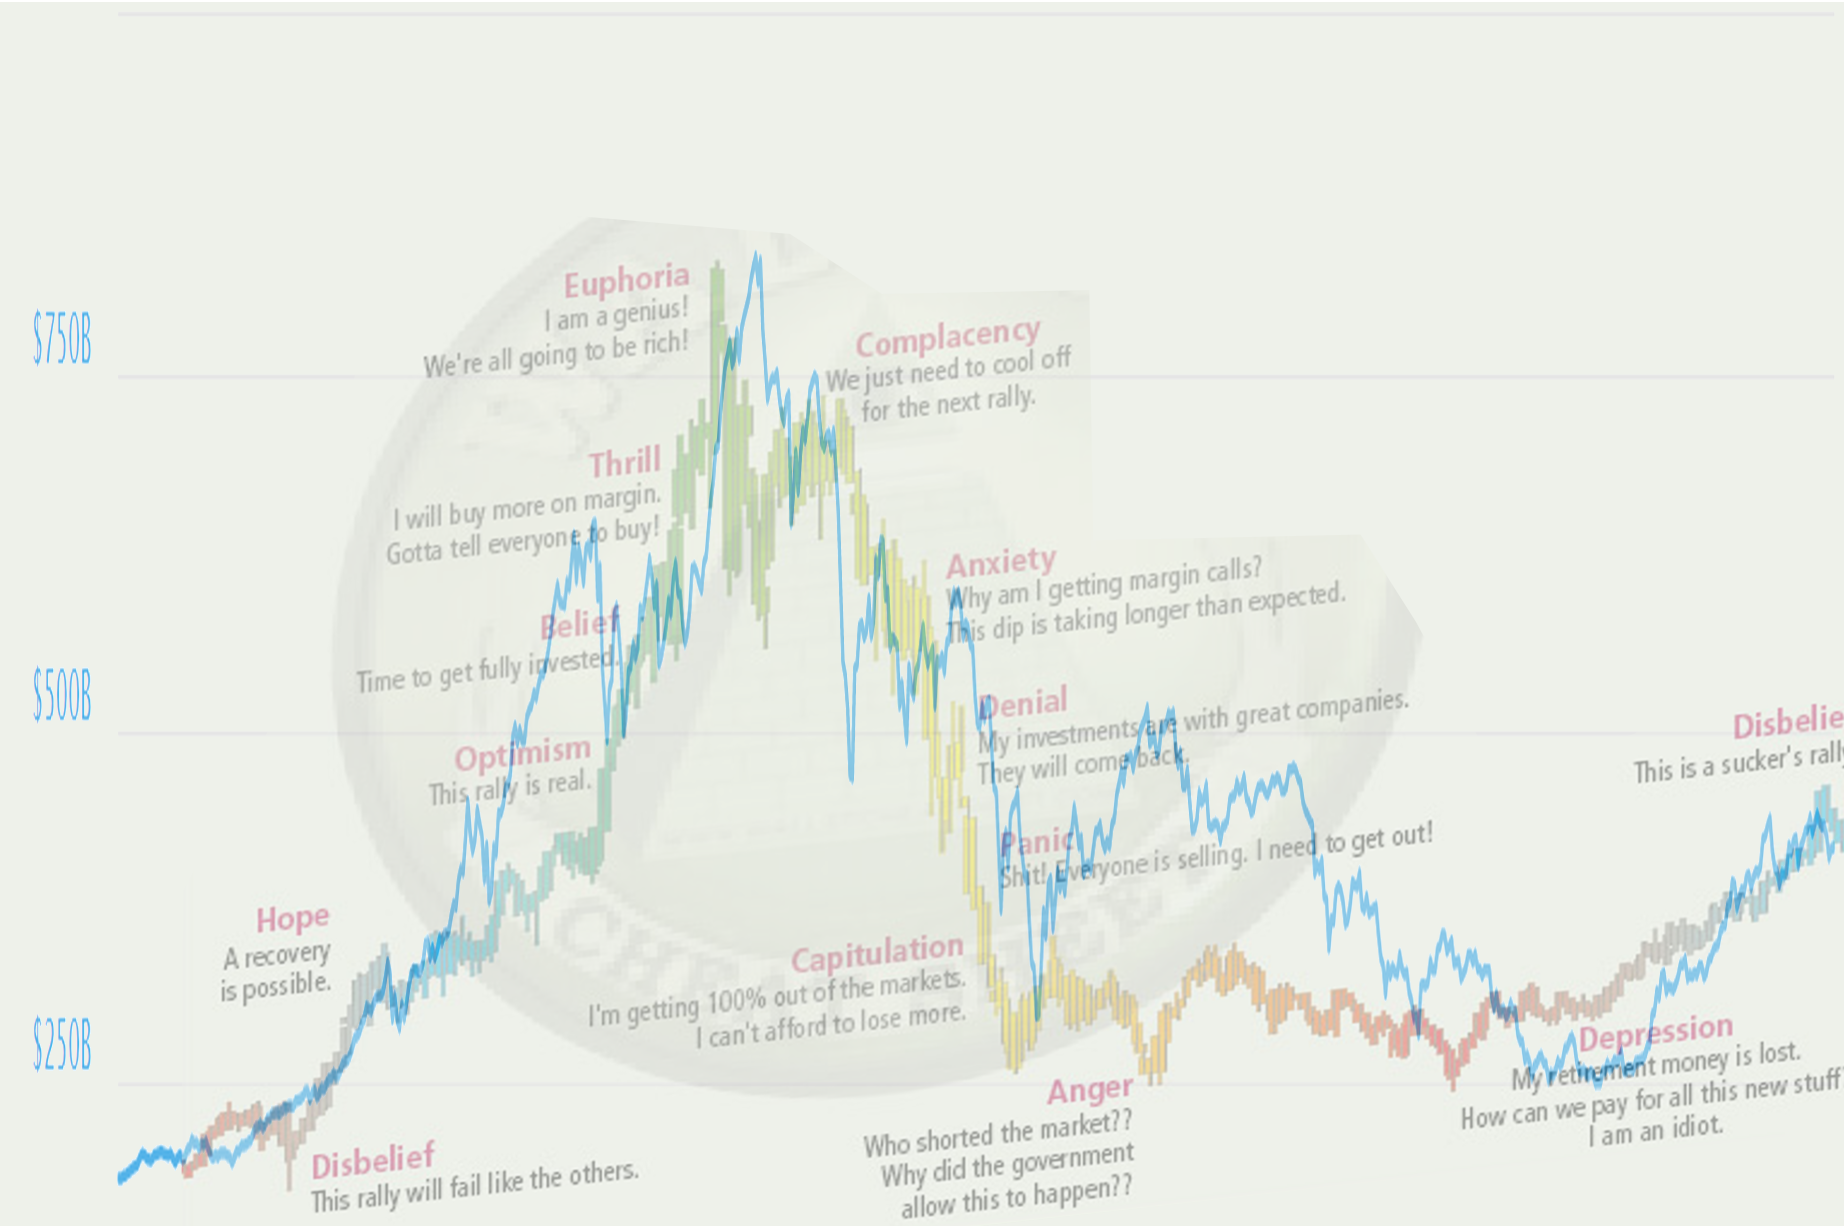
To each one of these examples I could apply the standard market cycle diagram (we'll get to that soon).
And here we sit. Between cycles. Just waiting for the next one.
Logarithmically speaking:
History teaches everything, even the future.
~ Alphonse de Lamartine
Remember that logarithmic view I spoke of earlier? Let's take a look at it now - next to the normal view.
Ah much better thank you! The logarithmic view lets you see the hidden peaks much more clearly. You don't have to zoom in to each individual time period, like I did in all of the "bubble" examples above. Here is a chart that highlights all of the "bubble examples" I mentioned:
You think the last cycle was bad? Just imagine the poor investors in early 2014! No end in sight, is there?
So if, hypothetically speaking of course, someone were to say to me:
Bit Brain you awesome legend you! We should all worship the very ground upon which you tread. I agree with everything you say except for: You know that diagram that everyone references about market cycles ? You've even used it yourself to good affect*** in a couple articles. Well I'm sorry to say that's not real!
The first part of the diagram cycle sure, that's what a new asset normally looks like and follows pretty much all those stages. But that's only the initial cycle, it doesn't keep repeating like that ! Everyone is waiting for the cycle to 'start over' with a huge spike up in price. It doesn't work like that, everyone is reading that diagram wrong.
I would have to politely (and again hypothetically) reply: "Thanks for the input kind person - but no." The cycle does repeat in crypto. It most definitely repeats! In fact the crypto market cap chart could be described as a chain of hype cycles with some short rest periods in between. You don't have to use that particular "Wall Street Cheat Sheet" chart. If it makes you happier then feel free to use the Gartner Hype Cycle chart - it amounts to the same thing.
I repeat Bit Brain's Third Law of Crypto: "Crypto does not bubble, it's a loose chain of hype cycles."
I have spoken a bit about bubbles before. I've definitely spoken about trendlines (a lot) and the general upward growth of crypto. If you want more justification for my belief in continued crypto growth then please read this, this and this.
History never repeats itself. Sometimes it just screams, "Why don't you listen to me?" and lets fly with a big stick.
~ John W. Campbell Jr
Crypto will continue upwards folks. It will continue upwards in hype cycles. Crypto will continue upwards in cycles whether you believe me or not! Just watch and see! 🤑
Have a lovely evening everyone. Spend it buying (good) crypto! You know where to find the best recommendations!
Yours in crypto,
Bit Brain
* Quote often incorrectly attributed to Mark Twain. Precise origin uncertain.
** Yes. I did invent the word "skepticryptocal" for this post. Feel free to use my intellectual property. Feel even more free to throw STEEM donations my way by way of compensation. 😋
*** I would also point out that they should have used the word "effect" and not "affect". Hypothetically.
All Bitcoin price charts are made by @bitbrain using TradingView software. All BTC prices are rounded off and approximate, I read them from the charts as presented.
The Market Cycle merge picture is from this post of mine.
DISCLAIMER:
I am neither a financial advisor nor a professional trader/investor. This is not financial advice, investment advice or trading advice. Unless otherwise stated, all my posts are my opinion and nothing more. Crypto is highly volatile and you can easily lose everything in crypto. You invest at your own risk! Information I post may be erroneous or construed as being misleading. I will not be held responsible for anything which is incorrect, missing, out-of-date or fabricated. Any information you use is done so at your own risk. Always Do Your Own Research (DYOR) and realise that you and you alone are responsible for your crypto portfolio and whatever happens to it.


