A look at the lastest trendlines - after the bear attack
We were attacked by a bear (market)
The bear (market) savaged crypto. But did it change the general trendline of crypto growth?
How the trendlines look now
Not too bad!
I do not see any significant dip or change to the trendlines. This dip was large and protracted. The reasons are numerous, a very overbought market corrected itself while simultaneously being hit by all kinds of FUD. The FUD examples are literally too numerous to mention.
The result was an overcorrection can be handled in two ways:
We could treat it as an outlier on the charts - let it break the trendlines, but not change them. It's a short-term anomaly. It's happened before in the highly volatile past of crypto. To treat it in this way would not be wrong, and it would allow for more precise predictions going forward. The trade off is (obviously) decreased prediction accuracy i.e. another outlier could occur and then that would fall outside of our new trendlines, leaving us in the dark. I have chosen to handle it the other way;
We could amend the trendlines to incorporate the recent large bearish overcorrection. I like this method; it's not better, but it includes all available data and will be more reliable going into the future (at the expense of precision).
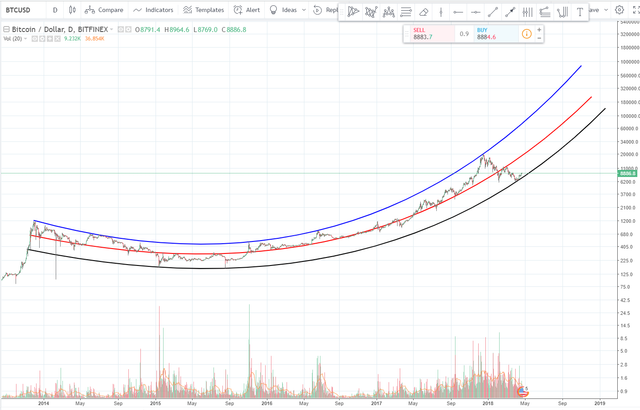
This is how I see the trendlines now:
Made by Bit Brain using TradingView
The blue line is the peaks line, black is the troughs and red is what I consider to be the mean (where the price should be).
I have used BTC instead of total market cap, because I can't do total market cap on TradingView. It does not change much (the general trends are similar), but it is worth noting that with the recent decline in BTC's market dominance, the total market cap picture is more positive than that of BTC.
The chart goes back into 2014, giving a fairly complete picture of relevant BTC history. It is worth noting that even on this logarithmic plot, the trendlines still curve upwards. This is because the markets grow so fast that they outpace logarithmic growth. I consider this to be indicative of the fact that:
Crypto investors are putting increasing amounts of their total portfolios into cryptocurrencies; and
New investors are entering the market at an increasing rate. (see this post for why that is: https://steemit.com/cryptocurrency/@bitbrain/bitcoin-price-predictions-chart-display-part-3-the-s-curve-more-good-news)
Full disclosure: I should remark that I am not completely comfortable with that chart. Looking at the red trendline, I think it is a bit too steep. I think that prices will rise slightly slower than what it seems to suggest. It is a very long-term chart and should not be used for accurate short to medium-term price prediction, use the next chart for that.
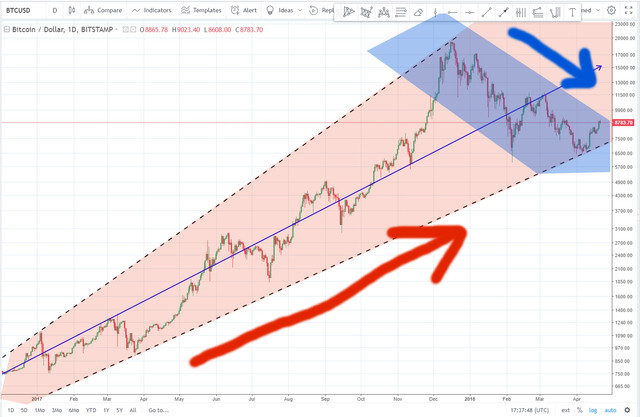
In the short-term you can use straight lines on a logarithmic plot, but they become increasingly inaccurate over time. I try not to use straight lines on periods exceeding one year. This is where I see the current medium-term market trend to be on a straight line logarithmic plot:
Made by Bit Brain using TradingView
The dashed lines are the maximum and minimum limiting lines for price and the blue trendline is where the price should be. I therefore believe that the price should continue to rise at a higher than normal rate until it meets this line again. (As I previously predicted and showed in this post yesterday: https://steemit.com/cryptocurrency/@bitbrain/bitcoin-predictions-by-bit-brain)
Summary
So the overall picture is that the outlook remains very positive: increasing market growth rate for the foreseeable future. Obviously more dips will occur, and probably more crashes if the market grows too fast again, but if you just keep holding crypto then you should win the long-term game.
Always keep an ear to the ground, but at the moment I see absolutely no indication that crypto will not continue along the path of these trendlines. If you're not in crypto yet, what are you waiting for?
Enjoy the rest of the weekend everybody.
Yours in crypto,
Bit Brain
DISCLAIMER:
I am neither a financial advisor nor a professional trader/investor. This is not financial advice, investment advice or trading advice. Unless otherwise stated, all my posts are my opinion and nothing more. Crypto is highly volatile and you can easily lose everything in crypto. You invest at your own risk! Information I post may be erroneous or construed as being misleading. I will not be held responsible for anything which is incorrect, missing, out-of-date or fabricated. Any information you use is done so at your own risk. Always Do Your Own Research (DYOR) and realise that you and you alone are responsible for your crypto portfolio and whatever happens to it.
Sometime I think we're looking at different charts, because your description of them is nothing like my perception of them.
For BTC, all I see is an extended downtrend with no indication of a reversal. For me, the price would have to at least break above that double top at the 11500 level, by some margin, before calling it. The chart looks in a range to me between 7 and 12.
What happened to all the 'moon shots' that have failed ? I know you haven't called them but everyone else did, all 8 of them so far. Why is this 9th one 'the one' ? Couldn't this just be a 50% retracement to the double top before continuing down ?
I'm not saying you're wrong and I hope for your sakes you aren't, but I just don't get the enthusiasm that 'this is the one'. I suppose if everyone calls it often enough then one time it'll be right.
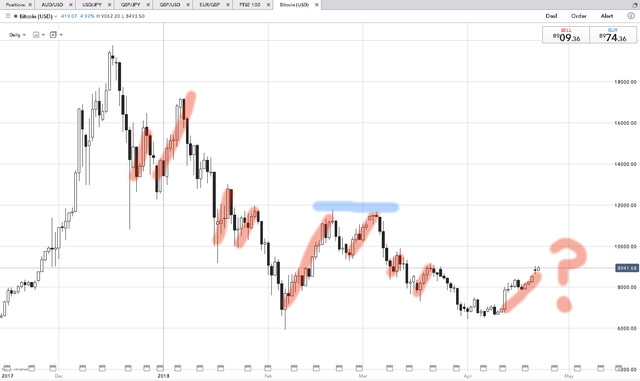
Step 1 - zoom that chart out.
Step 2 - look at the volume, not the price. Volume is one of the main indicators that this isn't another false rise. Volume, the double bottom and the gradual sideways-turning-upwards movement of the chart since early April.
Step 3 - realise that it may dip again, but should remain within the bounds of those trendlines I have drawn. More dip now just means more up later. I certainly expect a few resistance levels and retracements on the way up, but I stand more firmly than ever behind my general upwards trend.
This might not be the main rise, it might just be some positive sideways movement, but I am certain that the main dip is over. Hence after the bear attack.
Don't you find it fascinating though that two people can look at the same chart and see completely different things ? That's why I love it, it's where the liquidity in the market comes from.
On your chart, you see an ascending red channel, and I see a descending blue one. And both of us could be right (or wrong !) at the same time... that's why trading is so hard.
Maybe I should do a full chart 'reading' on BTC sometime, to show you how a price action Forex trader looks at the market, it maybe a lot different to how a crypto trader would view it.
Indeed. I attribute most of that to the differences between trading and investing: i.e. short-term price movement vs long-term market movement.
I guess if we all thought the same thing then this would be a very boring game and there would be no profits to be made from one another's mistakes! (I certainly helped a few people boost their balances when I initially started trading like a lunatic!)
Very true, if everyone thought the same there would be a worldwide shortage of Lambos and the moon would be overcrowded lol :-)
I really wish I could get more into long term investing on fundamentals, but I just have itchy fingers and need to be in the game constantly. Besides, I do 'ok' at what I do now, so why spoil a good thing... ;-)
I only want one Lambo: this one.

The one of a kind Aventador J sold for $2 800 000. At his request, Lambo built another one for Shaikh Al Yahyaa (price unknown). Maybe they'll build me one for 100 Dogecoin?
If you tell them Dogecoin is heading to the moon, I don't see how they can refuse !!! :-)
Well thousands seem to believe that Dogecoin IS! I still can't believe the market cap of that self-professed shitcoin!
Hi, I like the way you write articles. I will follow you, I hope you will follow me, as we are interested in one topic. Let's increase the power of Steemit together!
UPDATE: Not quite happy with my first chart, I have refined it (several times) to this: