BITCOIN BTC Jan 19 12 Minute Morning Update - Consolidates in Ascending Triangle. Bullish or Bearish? Both Views

Ascending triangle consolidation with many paths up and down.
We see BTC consolidate into an ascending triangle, though please always bear in mind that an ascending triangle is not always bullish. We have seen cases of these breaking down dramatically.
Here is BTC's ascending triangle.

Here is an ascending triangle of LTC that breaks down as an example:

Here is a bullish scenario of we break up. We first test resistance near 12,500. If successfully breaking the trend line resistance, we will see an attempt at $14,500.

Here is the bearish scenario of we break down. We assume targets of the general base height of the wedge. We see it's possible to break back down to the 9-10k regions, testing that support again. Where if that support fails, we will see sub 9k zones.

Pay attention to this key apex zone to see direction of breakout. Once these trend line resistance or support is broken, BTC will give general direction for alts as well.

Always be cautious, take high probability trades, plan entries and exits, stick to high reward low risk R:R setups. Good luck traders
Please consider these videos:
Lesson 1 - Bitfinex Tutorial - How to Customize and Set Up Bitfinex
Lesson 2 - Tutorial Part 2 How to Analyze Candlesticks Charts with Strategy
Lesson 3- Let's learn Moving Averages
Lesson 4- Let's Learn Relative Strength Index RSI with Advanced Strategy
Lesson 5 Let's Learn MACD and Histogram
Lesson 6 Let's Learn Margin Trading Long, Short, Leveraging
Lesson 7 Let's Learn Basic Risk Management
Lesson 8 Let's Learn Fibonacci Retracement Part 1
Lesson 9 Let's Learn Fibonacci Extension Part 2
Lesson 10 Quick Intro to Analyzing Level 2
Lesson 11 Introduction to Laddering
Twitter - https://twitter.com/PhilakoneCrypto
https://www.youtube.com/user/philakone1
If you enjoyed this video, please like, subscribe, follow, share, upvote, or donate to Luna!
Luna's personal bitfinex account:
BTC address: 1PruhmsYXU2gPkNw574xZSMyBG4YW5Wnq9
Ethereum: 0x2538b728f9682fc1dc2e7db8129730f661753850
LTC: LPeaZpGiF3XdCw5XPN7LXztDagTEZAMgYd
Bitcoin Cash: 1AY2FPANCe5URB71Nvy6tkCgoTS8iHgmZD
The ultimate goal is to help the crypto community because I think there's a lack of these type of videos. I want to share everything I've learned because knowledge is only power if passed on. These are educational videos intended to teach how to think through thought-out rationalization.
DISCLAIMER:
Legal stuff here. I'm not financial advisor. This is just my opinion that I'm sharing with the community. All information is for yours to process how you wish.
i agree on the patttern but let's have look at the definitions.
http://thepatternsite.com/EWTriangleAscending.html
http://stocata.org/ta_en/elliott6.html
as you will see, the ascending triangle in a bear market will result in a drop not up.
also, we need to keep an eye on the wave 1 of C and the retracement of the wave 4. They shouldn't cross but the target you give does.
Please feel free to correct and educate.
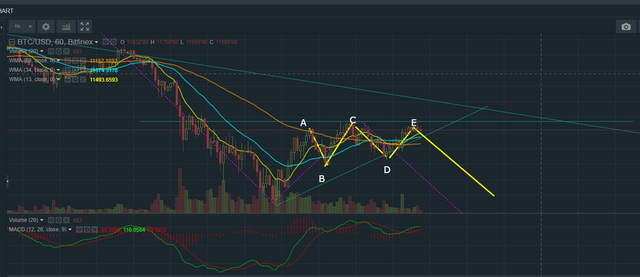
they can overlap fine in many circumstance with subrules. here's one as an example from a text book. this rule holds true for corrections in specific sub waves and specifically in ending diagonals as well. and more.
Love the last part talking about the different plays we should be looking for. Those are indeed good plans and now I don't feel lost what to do going forward with BTC and all the altcoins. Thanks for the valuable lessons once again! Upvoted you!
Beautiful analysis straight to the point !! Like your 2018 style !!
nice work. I think we are dropping since the volume is decreasing and we are going to need a lot to break through 12k
I believe that a lot of markets will have patterns similar to head ad shoulders that will lead to new all time highs very soon.
Thanks for update :-)
Please check my post about long term expectations for btc, I'm learning TA and it took me some time to do it, so it could be great to tell me what you think about it :-)
https://steemit.com/crypto/@adri1202/future-of-cryptos-new-apocalyptical-hypothesis-descending-triangle-for-btc-and-ltc
You can't count 5 waves in the last downtrend ? YES YOU CAN !!!
Not saying it's not an abc, just that one count is possible, anyway I'm maybe wrong somewhere lol :-)
yellow : main / green : secondary / blue : 3rd level (not all on chart)
Please check also my blog, made a new post about desceding triangle correction of BTC and future of crypto, took me some time to do it, would like to have some feedback on it ! Thanks :-)
Always a pleasure to see your videos, Phil. Been 4 months since I started following you. Your tutorials + Haejin's tutorials really got me on my feet in this space.
I think you will grow strong over time here on Steemit. I feel bad I haven't been here to upvote you in the past, just been busy with my own life. But I'll make sure to jump here for your videos instead of youtube! As I hope many of your following will do eventually, if they already havent.
Your ascending triangle for LTC is just lines drawn on a chart. Triangles are triangles because they have a ABCDE that touches the top and bottom lines. If you were to change your resolution on the LTC chart you will see that a smaller triangle at the end of the triangle has a A-E correction that starts at the bottom. If you also measure the height of that smaller triangle at the back that will be roughly the amount of drop on the front.
Just because it looks like a triangle does not mean that it is an actual A-E triangle.