1/21/2017 The Market View and Trading Outlook
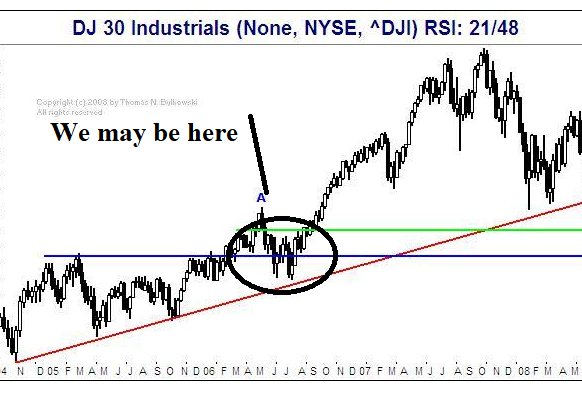
Back to the charts and let’s step back a bit and start with the big, big picture.
What we are on the verge of at the moment is a busted ascending triangle. In which case if we close below the start of the triangle at $9236 the average follow on decline is 11 percent which would put us at $8220; this is just an average decline post pattern failure; could be more, could be less. What I find a bit concerning is that if the pattern does bust we would be in moving average free fall territory with no clear line of support. The weekly 21 MA is at $8900 so it would put up a fight before succumbing to downwards pressure, likely get some good bounces around that area before failing in spectacular fashion to possibly find the 3 day 77 at $6700. That said if price heads in that direction look for a spectacular buying opportunity in the form of a fast bullish hammer. Basically price will be at that level and above that level in a very short period of time. Think of it as a fire sale that will be purchased up very quickly.
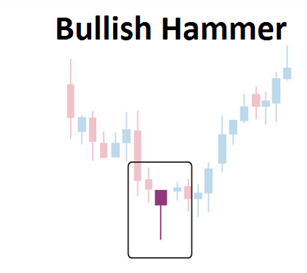
You see bull hammers a lot when price is rapidly rising on the smaller time frames; a run up, huge sell off, price pushes right back up and continues on its way. I tend to do well on those as the wick is usually a simple 50 percent Fibonacci retracement of the prior move and lasts all of a minute or so before continuing on.
Getting back on track let us get objective.
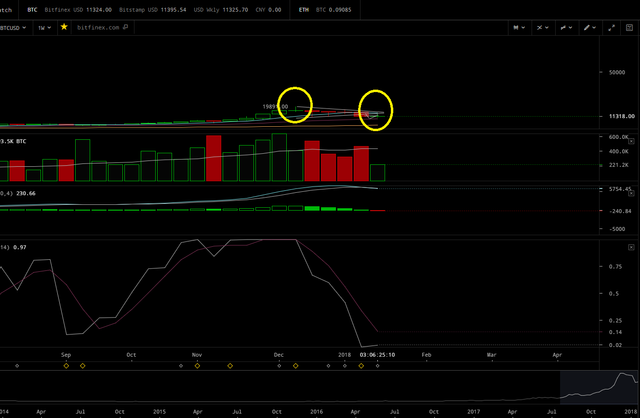
I usually start at the 12 hour, but I’m going to go weekly chart this time around so as I can keep my objectivity and make sure I am open minded to the bigger picture. To that end, the weekly is showing no love for us at the moment. The MACD histogram is in the Red and we typically average a minimum of 2 or more red bars on the histogram before things turn around. So the most recent downturn may just be getting started and I would not expect a quick turn around; however, this is crypto and things can turn on a dime.
The MACD/Signal line did cross to the downside while in high territory giving us plenty of room and momentum to make some spectacular lows. The RSI has us entering oversold territory at .15 with previous turns to the upside happening at .08 or below; so again we have further room to the south. On the positive we may have a doji forming which could signal reversal to the upside, much in the same way the one preceding it signaled a reversal to the downside.
But again this is the weekly chart so things play out slowly and even if we had a doji the period does not end till January 24th and we would need a further close above the top of the doji wick to signal confirmation of reversal which would be around the first of February. We also have the 21 MA at $8900 and it should offer support, a bounce and maybe another point of reversal. All in all, nothing in this large frame is saying buy.
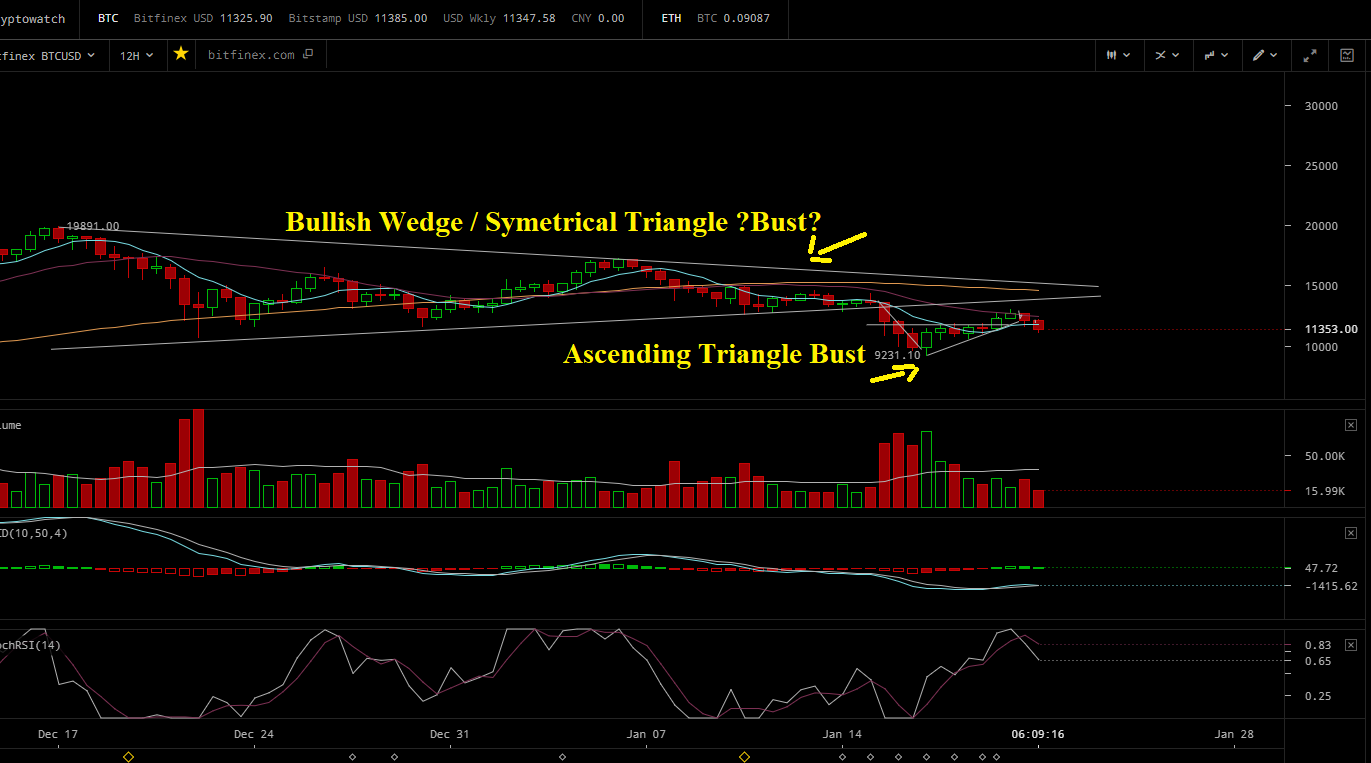
The 12 hour and this is interesting as you have to always be cognizant of the bigger picture, the patterns within the patterns and remain open to all possibilities. I tend to keep my lines on the chart until they are no longer of intrinsic value towards prediction or study use. So let us break down what I have so far while taking no options off the table.
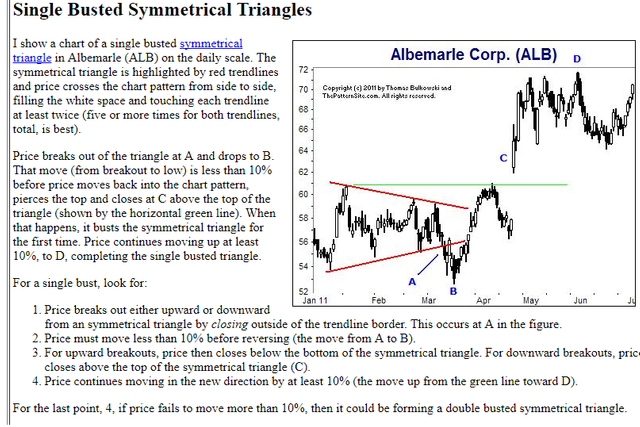
In looking at the 12, we still have 2 chart patterns is play. The first was the symmetrical triangle that for the moment looks like it bust at $13,000 and may very well bust around $10,600. Oddly as it broke below, all is not lost and we could get a longer term reversal like the following.
I can’t stress it enough that you cannot get tunnel vision when performing TA, or trying to trade successfully; you will get killed. You have to keep all options open, always go back to the big picture and try and determine what the longer term move is going to be. So even though things are somewhat bleak after last night’s rejection at the lower boundary of the previous ascending triangle look at the pattern below and realize that it is for the moment at least still in play. Keep in mind that each bar is 12 hours so it takes days or weeks for things to develop. Crypto has killed much of the patience that a successful trader needs to succeed, everyone wants it now, if it it’s not gaining 5 percent a day we must be crashing and chicken little comes out to tell us the sky is falling.
Below the symmetrical triangle we had an ascending wedge that broke out at $11,800 made a move and likely busted as well, but it’s hard to tell as of yet. As traders we must have rules, and we must adhere to them regardless of our feelings. That said, one of the rules for an ascending triangle to be declared a “bust” or “failure” is a breakout, less than 10 percent up or down and a reversal. On my charts, I have the breakout at $11,855, so we needed a gain of $1,185.50 to confirm the pattern or a break out to at least $13,040.50; we hit $13,017 before reversing. It’s so close that I can’t,at this point, invalidate the previous pattern, but holding die hard to the rule, we only moved 9.8 percent before reversing so it may be on the way to a bust and we will know for sure if price closes below the start of the pattern at $9331. So it’s iffy at the moment and this may simply be a pullback prior to continuing above $13,040.50. In which case we are looking at a picture similar to the following. (again always keep an open mind).
Objectively without the patterns we have a decreasing histogram indicative of a rapidly cooling buying period, a possible upcoming MACD/Signal line cross, but it is occurring on lower volume so it may bounce and reverse upwards. We do have a cross in on the RSI to indicate sell, but this is not a reliable be all end all indication as it may cross up and down a few times in the overbought range as price rises before pulling back. Regardless nothing is saying buy and the RSI is saying "stay on your toes, be aware of a potentially larger trend or upcoming reversal".
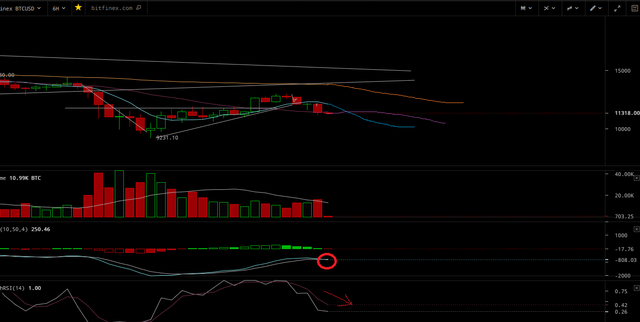
Onto the 6 hour..Yeah, no bueno here for the moment. First bar of the selling period on the MACD Histogram, we do have an MACD/Signal cross to the downside (no good) and RSI is rapidly retreating at .28 with an average turnaround of .03 so there is more room to the downside than the good. We never hit the MACD 0 line before reversing which is indicative of buyers having no faith and selling volume dramatically increased to dwarf the prior buying volume; 16k to 13k respectively or +19%. Nothing here saying to buy at the moment. We did have a doji warning at the top around $13,000.
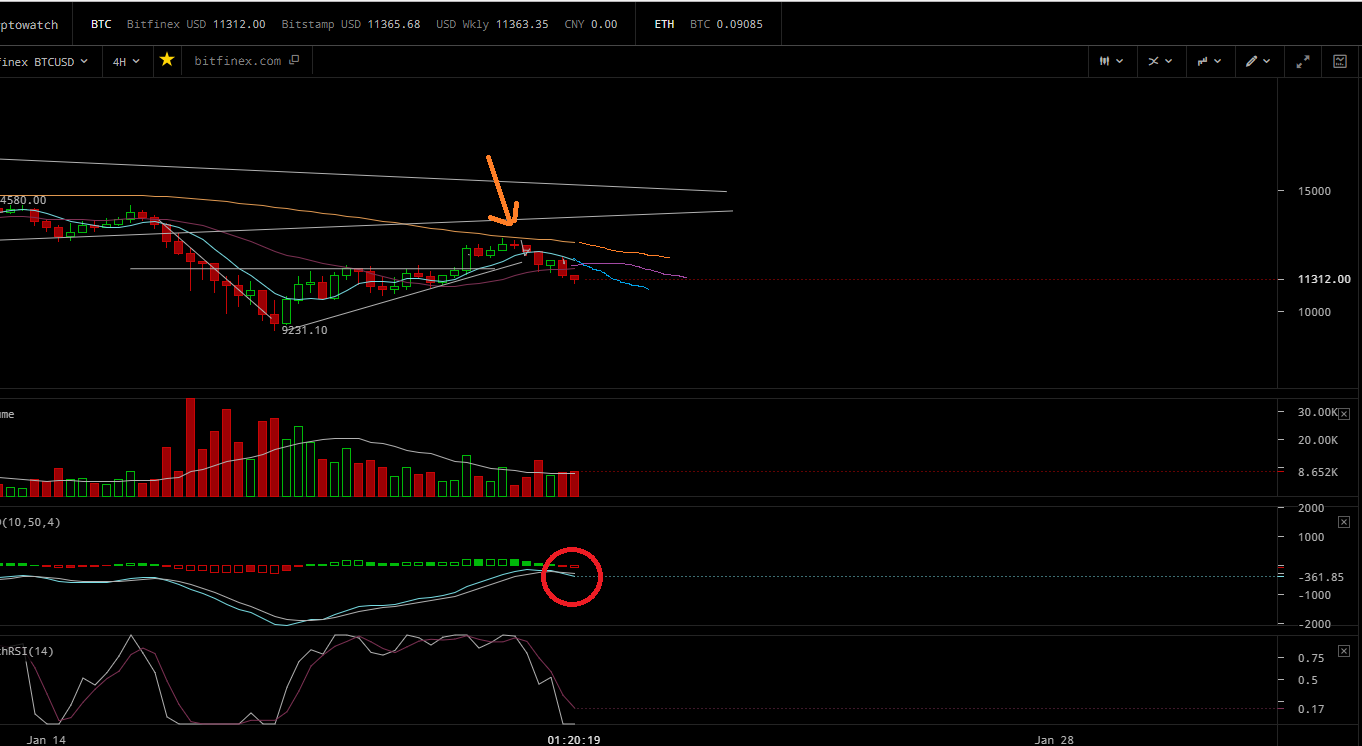
The 4 hour is essentially the same story as the 6 hour; increasing seller volume, histogram selling period, MACD/Signal cross to the south, RSI retreating toward the bottom etc. Looking at the MA’s and the angle of the dangle in regards to the 7/21, it looks likely a downward cross is in the works that would bring further losses. Possible trend lines included.
The 2 hour and 1 hour I’m not going to post as they don’t really matter when the larger time frames are as uncertain as they are and all indicative of sit it out for a bit.
Briefly and you can go here: https://cryptowat.ch/bitfinex/btcusd/2h and look for yourself. The price on both is below the 77 and the 7 on both has decisively crossed below the 77, both show MACD breaches of the zero line and entering oversold territory on a rapidly retreating RSI. The 1 hour looks a bit better as we had a buying hour last hour, but its volume did not exceed the selling volume that preceded it. The two hour at this time shows increasing selling volume that may be waning and give way to a small bump up on price before we either crash back down as we fail to breach price above the 77 on the smaller frames, or breach the longer MA’s in the smaller frames and move back towards $13,000. Basically it’s to hit or miss at the moment to risk capital with the majority of indicators and patterns pointing down. I made my moves yesterday, last night and this A.M. so I will wait for a clearly defined trend before jumping into the wood chipper.
My Previous Analysis:
https://steemit.com/bitcoin/@pawsdog/1-20-2017-the-market-view-and-trading-outlook-evening
https://steemit.com/bitcoin/@pawsdog/1-19-2017-the-market-view-and-trading-outlook
https://steemit.com/bitcoin/@pawsdog/1-18-2017-the-market-view-and-trading-outlook
https://steemit.com/bitcoin/@pawsdog/1-16-2017-the-market-view-and-trading-outlook
https://steemit.com/bitcoin/@pawsdog/1-15-2017-the-market-view-and-trading-outlook
https://steemit.com/bitcoin/@pawsdog/1-14-2017-the-market-view-and-trading-outlook
https://steemit.com/bitcoin/@pawsdog/1-13-2017-the-market-view-and-trading-outlook
https://steemit.com/bitcoin/@pawsdog/1-12-2017-the-market-view-and-trading-outlook

Beep! Beep! @shadow3scalpel at your service. I am here to assist all military members on Steemit. This HumVee will be scouting posts from a list of Veterans that is maintained by @chairborne. If you are a Veteran and new to Steemit, and you have questions or want to join the Veterans community, reply to this comment. We got your six, unless you are in the rear with the gear. Ooh-Rah!
Comment by @inthenow. This is a opt-in bot.
I have to say that at 6700$ I am a buyer, a happy buyer. Overall I feel same as you, will wait things to play-out. No need to rush it, I am better off watching, instead of sweating.
very true, watching is much better than sweating and worrying.. plus watching is free.. :)
If it comes down , i will buy more !
If it does.. it's on the fence at the moment...