ZECUSD - Technical Analysis October 4, 2017 - Current Price $243

ZECUSD
In a previous analysis we laid out some important levels for traders and investors and ZECUSD managed to slip through our bearish threshold, from $293, below $266 and is trading at a $50 discount to our first analysis.
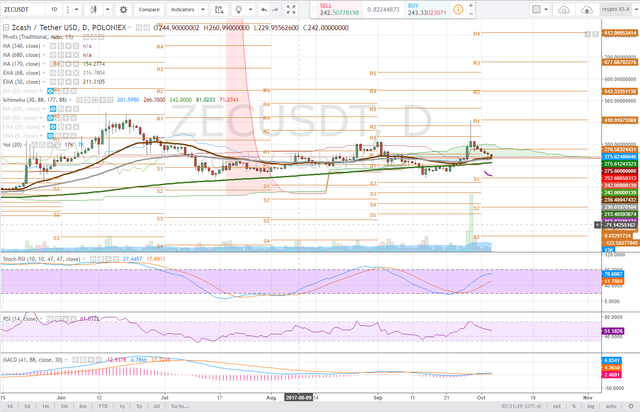
daily
Everyone had something to say about ZEC just a few days ago, however, we saw the blow-off top and waited to take a position. At the time I had posted there was a risk trade provided, but more importantly, ZECUSD failed to hold our $266 pivot support.
Having another look we see that the price has found some support at the 30ema on the daily timeframe where a moving average convergence is occurring. Bulls would like to see some buying pressure come into push the price back up, or hold this level for some further consolidation as the area of support is clear on this time frame.
All of the momentum indicators are in a neutral range, suggesting few buyers, few sellers.

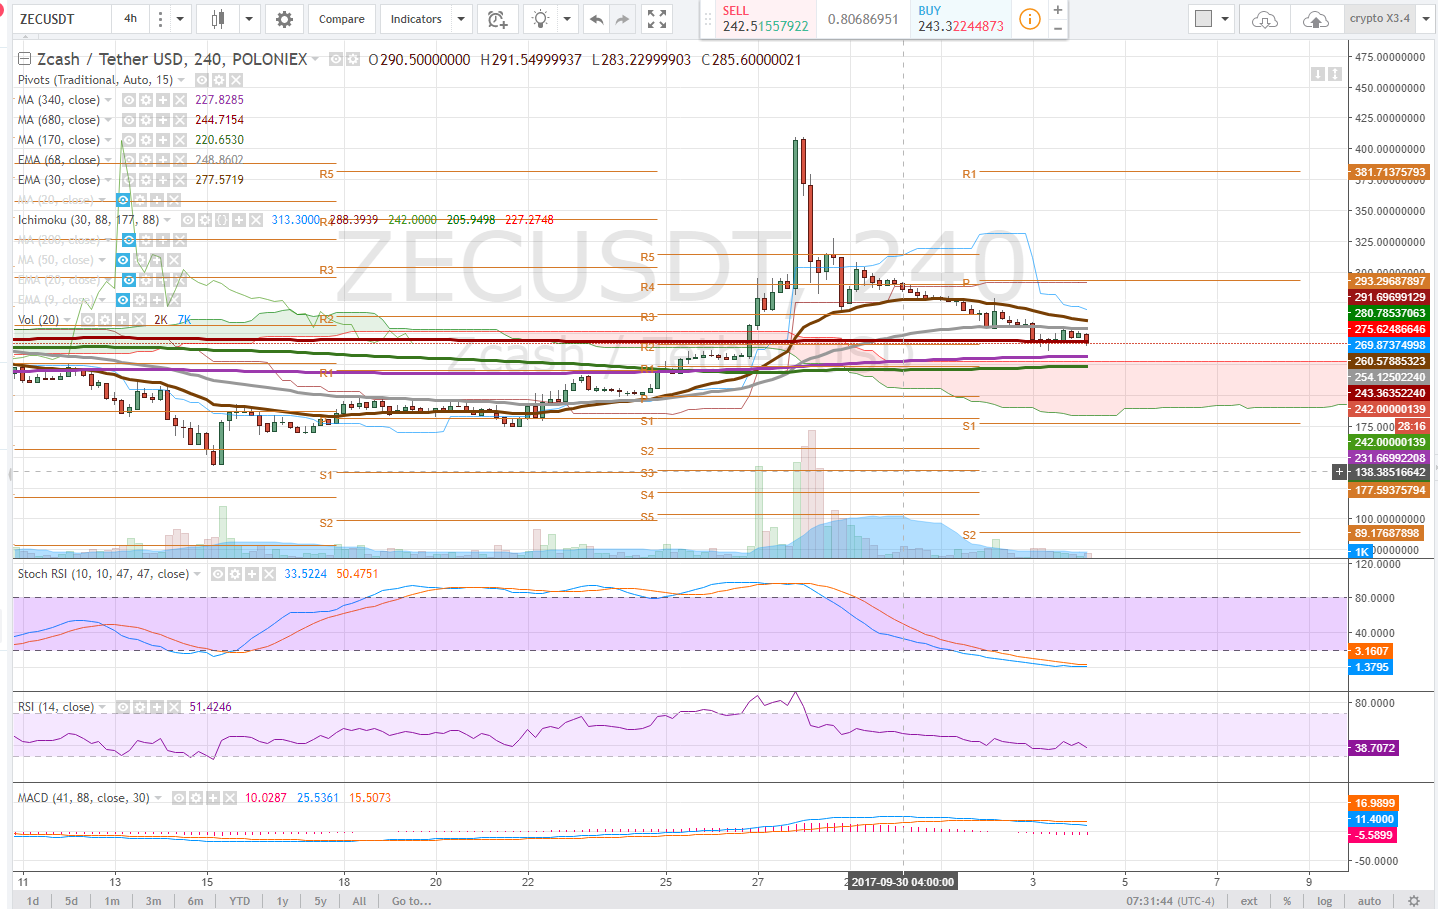
4 hour
On the 4 hour time frame we make note of the stochastic RSI which has cycled into downtrend and dragged the RSI into a neutral range with support being found at the 680 day moving average. Bulls need to hold this level and bounce as the next real area of support on this time frame is pivot S1 (provided the price can't hold the moving averages as it trends down).

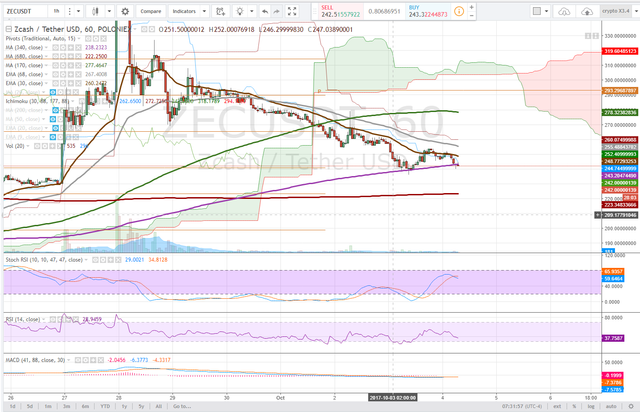
1 hour
A bearish convergence of moving averages occured during the price drawdown on the 1 hour time frame and price progression will be obvious if ZEC can begin to reclaim these areas. Again the Stochastic RSI, MACD and RSI are all in a relatively neutral range.

ZEC is a midground trade, taking a long or short position here without clear direction is equivalent to gambling. Traders and investors must wait to see some conducive price action. I take a bullish lean because of my own bias, and buyin here would suppose the 680dma holds on the 4 hour chart.
Bullish Above: $230
Bearish Below: $254
RISK TRADE: Take a long position here, no sense in shorting it here but be sure to set a stop loss according to risk tolerance.
Previous Articles:
XMRUSD
BTCUSD
LTCUSD
U.S. Dollar Index
ETHUSD
Follow at your own risk, Not a financial adviser, understand the risks associated with trading and investing. Manage your own Risk - in other words you could lose it all and it's your own fault.

good post
thanks!
welcome
thanks for sharing @ satchmo the post.
Good day @satchmo I appreciate all the info and hard work thank you :) Followed
thanks, hope i can help people to learn charting. Trying to provide swing trade setups by outlining important levels
@satchmo got you a $7.36 (4.0%) @minnowbooster upgoat, nice! (Image: pixabay.com)
Want a boost? Click here to read more about @minnowbooster!
The @OriginalWorks bot has determined this post by @satchmo to be original material and upvoted it!
To call @OriginalWorks, simply reply to any post with @originalworks or !originalworks in your message!
To enter this post into the daily RESTEEM contest, upvote this comment! The user with the most upvotes on their @OriginalWorks comment will win!
For more information, Click Here! || Click here to participate in the @OriginalWorks writing contest!
Special thanks to @reggaemuffin for being a supporter! Vote him as a witness to help make Steemit a better place!
Good statistical information shared