ETHUSD - Technical Analysis - September 27, 2017

ETHUSD
Looking at Ethereum for an opportunity to take a position either long or short. When we view a few time frames we see that the momentum indicators are not in alignment - That makes a position bullish or bearish relatively risky. With Bitcoin pushing into $4000 yesterday the alt coins market obviously followed suit with some decent rallies all around, but the battle is not over and it is infact likely for Bitcoin to retest that $4k level (approximately $4040 on the daily time frame is pivot support). If you recall yesterday, we were bullish above $3976, and bearish below $3850. While that may seem like a large range, in percentage terms, it is not, and with the recent volatility it was prudent to know key areas of support an resistance. We will do the same analysis on Ethereum
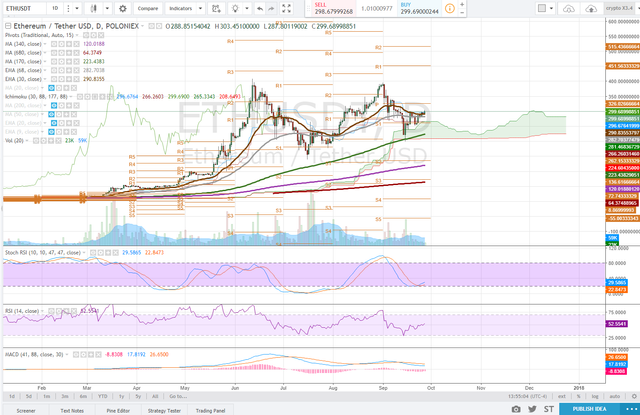
daily
On the daily time frame Ethereum has backtest and held the 30ema putting the daily pivot in site, approximately $326. Notice again, the stochastic RSI never reached a full downtrend cycle. What we are looking for here is bullish divergence in the MACD to drive the price up to the pivot on volume. The RSI is relatively neutral here, tho a downtrend can be drawn.
Crypto does indeed make some wild moves and a W formation can be observed in Ethereums recent price action off of the low $200's range.

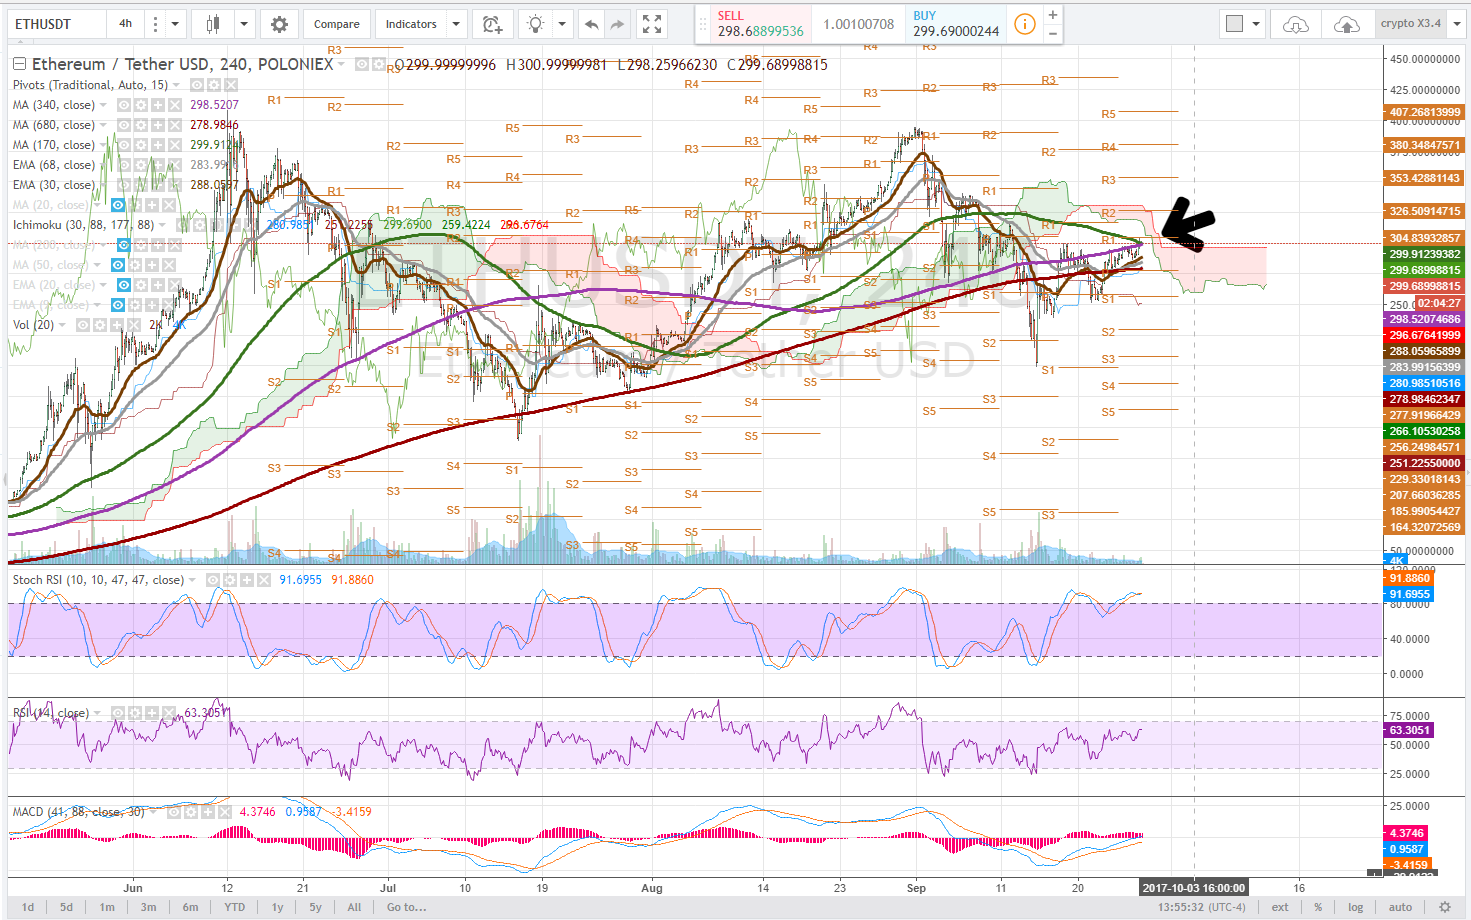
4 hour
On the 4 hour time frame we are seeing a bearish convergence of the moving averages. If the green line falls below the purple, taken into consideration with the overbought nature of the stochastic RSI and declining volume as the price appreciates, caution is warranted.
A ascending wedge can also be drawn here, the formation is considered bearish.

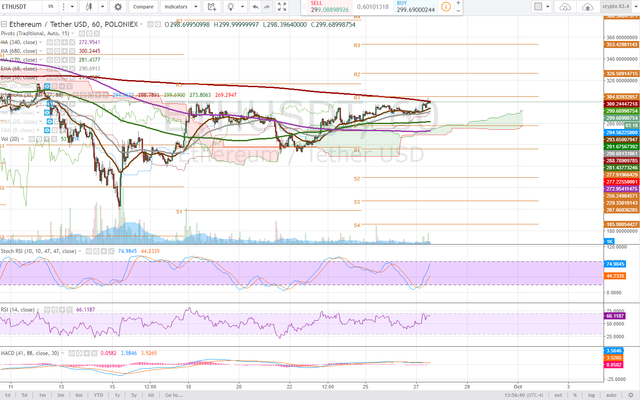
1 Hour
On the 1 hour time frame, ethereum is facing resistance at the 680 dma (red line). This is a tough area of resistance for the price to break out of. While it is flagging the next area of real resistance is nearby, $305

Bullish Above: $310 - use a tight stoploss.
Bearish Below: $290
RISK TRADE: Scale into a short position, if $310 breaks, close out and go long.
Previous Articles:
BTCUSD
Bitcoin
Weekly Overview
ETHUSD
bullish setups
Follow at your own risk, Not a financial adviser, understand the risks associated with trading and investing. Manage your own Risk - in other words you could lose it all and I could give a fuck.

Great analysis as always brother. It's testing $305 and I thought it would push through to $310 but not finding support. If BTC can find support to push through $4200 I think it's very bullish and will pull ETH along for the ride.
Thats right! Im trying to provide swing trades and so i realize its safer to throw out areas that are critical to progression/regression rather than straight up risk trades.