XMRUSD - Technical Analysis October 3, 2017 - Current Price $90

XMRUSD
In a previous analysis we made note of some important levels to watch and take a position if the price were to show us real progression or regression. XMRUSD was forming a descending wedge, typically bullish pattern. It has since fleshed out a little more. This is also a bull flag - though i know it looks atypical.
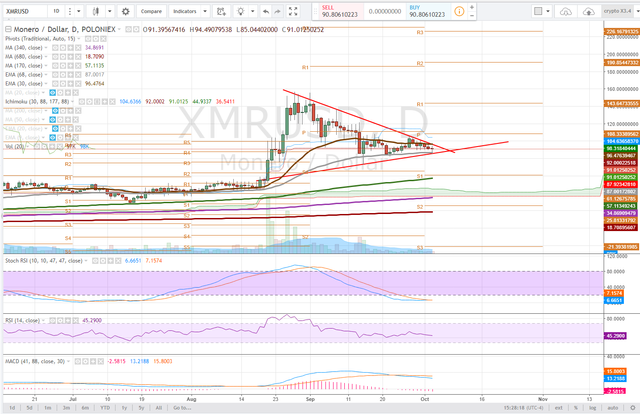
daily
On the daily time frame, we have redrawn the wedge. This is an example of why taking a bullish position inside the wedge was a risk trade as it lost those critical support levels and never went anywhere significant for the bulls to profit.
With the RSI still in neutral and the stochastic RSI still in down trend, we are seeing solid signs of life in the candlestick pattern for today, currently a bullish doji which typically is indicative of a trend shift. There is still time in the day, a hammer candlestick would be even better as the doji typically indicates indecision as much as the start of a reversal.
Todays candlestick caught support at the 68ema and bounce quite sharply. Bulls would like now to take back the 30ema and consolidate or breakout of the wedge entirely on volume.
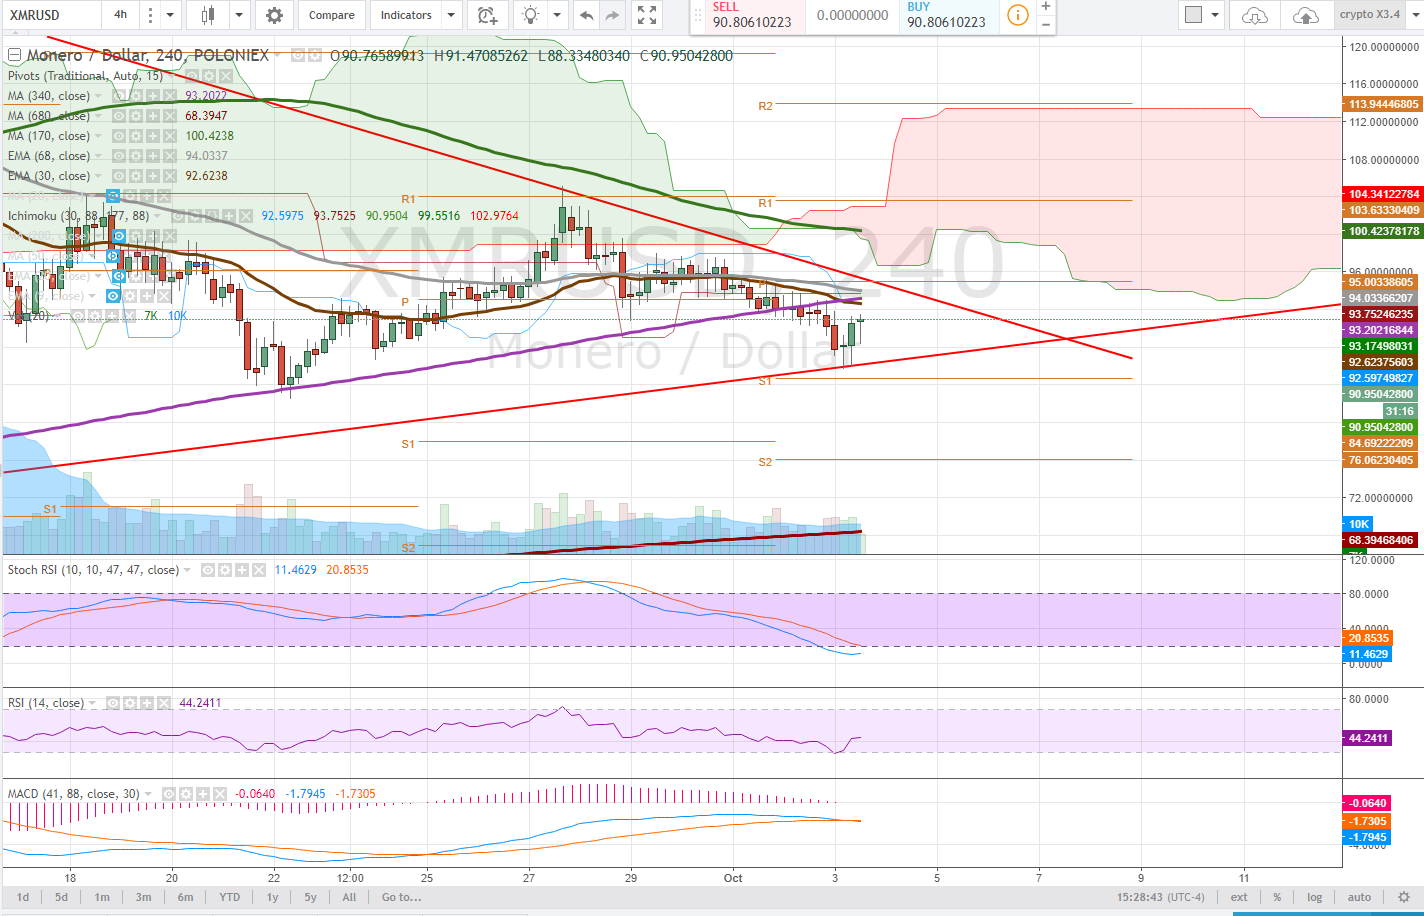
4 hour
The 4 hour chart is showing us the test of the lower trendline which was confirmed by the follow up candlestick. The stochastic RSI is just entering downtrend, and so this may take some time to play out. Bulls need to hang onto this trendline.
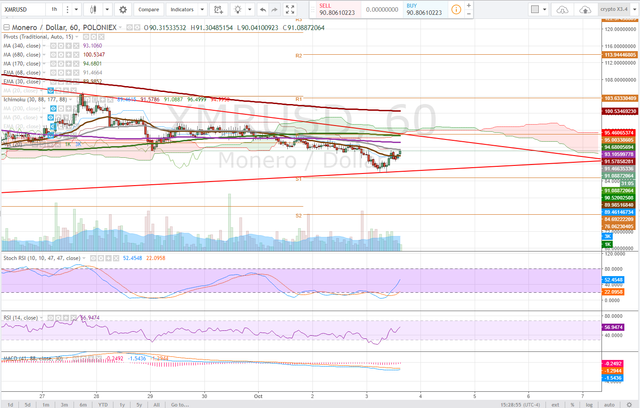
1 hour
The 1 hour time frame is looking good as the stochastic RSI pushes back towards uptrend. Notice our trendline support was tested twice here, each candlestick wicking off of the line - buyers.
If the price can keep pushing a bullish MACD cross can drive us through the moving averages and up for a test of the trendline resistance. Ideally for bulls we break it and make a move for a test of the daily pivot - $108.
$100 is a psychological resistance and will be difficult to break and hold.
Bullish Above: $97. Very bullish above $108
Bearish Below: $87
RISK TRADE: enter into a long position here. set a stop loss just below trendline or a % within your comfort zone.
don't forget to set stop losses!
Previous Articles:
BTCUSD
NEOUSD
BCCUSD
LTCUSD
ETHUSD
Follow at your own risk, Not a financial adviser, understand the risks associated with trading and investing. Manage your own Risk - in other words you could lose it all and it is your own fault

Might be one of the right choices on the market
I really like the set up - if she turns bullish can be a big move!
I believe Monero will rise again soon enough to around the $120 mark it was at. Buying around $90 would be a good investment to hold until then, if possible a few on them for a quick profit.
buying around 90 would be a good entry, provided trendline holds, as the TA suggests. Thanks for commenting!
Yup, well we may see another $4000 BTC line again and then another rise, so I would like to see prices then. You're welcome, happy to comment.
This deserves some attention. Upvoted and resteemed :]
Thanks for your support!
Super!
I just signed up for Forex Trading and this is helpful for newbie like me. Thank You
you are welcome, just careful, forex is treacherous, depends heavily on macro economic fundamentals! Good luck!
regarding Forex - https://steemit.com/bitcoin/@satchmo/the-u-s-dollar-index-and-why-you-should-learn-about-it-usddxy
Bitshare will delete in Bittrex
https://steemit.com/bitcoin/@rosetrader/darcrus-bata-dt-token-deleted-on-october-13th-2017-in-bittrex
I flag spam.