Atomic Force Microscopy: Feeling is Seeing
As a graduate student studying chemical engineering, occasionally I have the privilege of being a teaching assistant for various classes related to my field. This semester, I am the teaching assistant for a lecture and lab course about analytical techniques that may be used to characterize polymeric materials. For those of you unfamiliar, my research is primarily in polymers for membrane separations. I specifically work on modifying the designs of membranes that are used for saltwater filtration, or desalination, but I'll save a full discussion on that for another post.
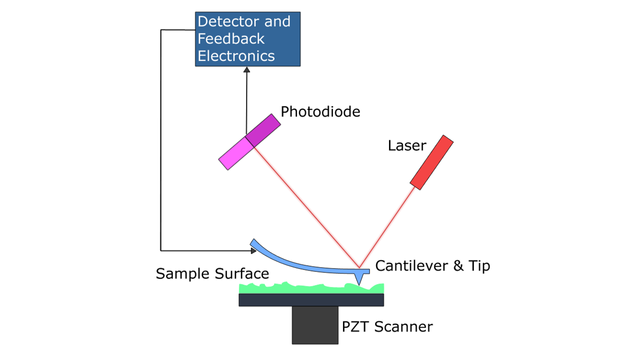
A diagram of the main components of atomic force microscopy. By Askewmind at English Wikipedia (Transferred from en.wikipedia to Commons.) [Public domain], via Wikimedia Commons.
Throughout my research, I've had the opportunity to use various characterization instruments, so the professor for the course this semester asked me to give a lecture on one of my favorite techniques that I'm very familiar with: atomic force microscopy (AFM). I've been researching AFM for that upcoming lecture, and I thought that many Steemians would find it interesting, so I've decided to share this blog with you so you can learn the same things as the ten graduate students I'll be lecturing to on February 12. So, without further ado, let's dive into surface microscopy.
Introduction
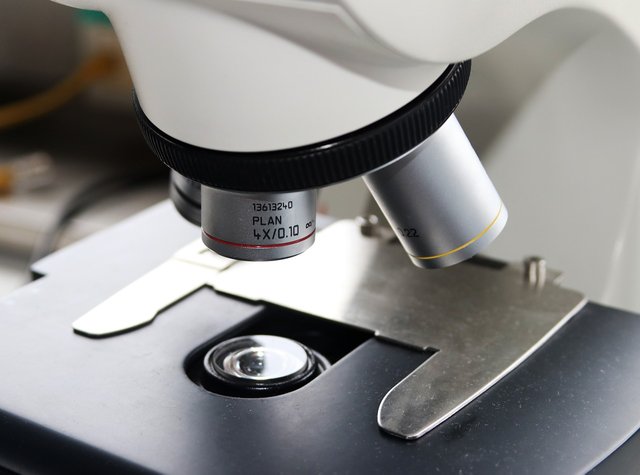
One of my favorite things to do as a child was get out my toy microscope that my parents gave me for Christmas one year and find various things around the house to look at under high magnification. It was always fascinating (and perhaps disturbing) to look at various water sources, specifically to compare our drinking water (from a well) to the water flowing in a small creek behind our house. I also recall pressing my finger against a piece of scotch tape and viewing the oils from my fingerprint on the surface of the tape. It can be a fantastic learning experience to view things that are too small to see with the naked eye. Science has come up with many advances to accomplish this goal throughout the years, and atomic force microscopy is just one of them.
Typical light, or optical microscopy, like you'd accomplish with a regular microscope involves the use of lenses to magnify small objects into a frame where we may view them on a screen or through a viewfinder. Therefore, the smallest objects that may be viewed directly depend on the ability of the lenses. We have an optical microscope in our laboratory that can magnify things up to 200 times, which is pretty good resolution for seeing things on a micro scale.
For Tiny Things, We Need Prefixes
Before we move any further, let's discuss some terminology. In the metric system, prefixes are used to define the scale of various units. For example, in our case, we'll be discussing length and height measurements, which are reported in meters. Add a prefix to the word meter, and you'll be able to get an idea of how much smaller or larger something is than the base unit of one meter. Add kilo- and you're talking about 1000 meters. Add deka- and it's 10 meters. Then we can go smaller than a meter by adding centi- (1/100) or milli- (1/1000). Even smaller still is the prefix micro-, which is one millionth of a meter. Our eyes are capable of seeing some things on the upper end of the micro-scale, for example human hairs usually have diameters which are measured in micrometers.
Microscopes get their names because they are used, generally speaking, to study things on the micro-scale. That is, things that have dimensions in micrometers (Micrometers are so widely used in scientific literature, that you'll often see them called microns as well. It's simply to shorten the word, so don't be alarmed if you see both terms used interchangeably.) However, when we move smaller than micro-, we must seek other techniques to observe objects and phenomena that occur on such scales.
A nanometer is 1000 times smaller than a micrometer. You're probably familiar with the prefix nano- given that nanotechnology has become a popular subject to discuss across many scientific fields. Since processes that exist at the nano-scale are important to our understanding of the world, various other imaging techniques have been developed to observe such small things. I may discuss these other techniques in later blogs, but for now, just know that there are several ways of viewing things that exist at the nano-scale.
Atomic force microscopy is one of these techniques.
AFM: Just Like Touching an Apple With Your Fingers... Sort of.
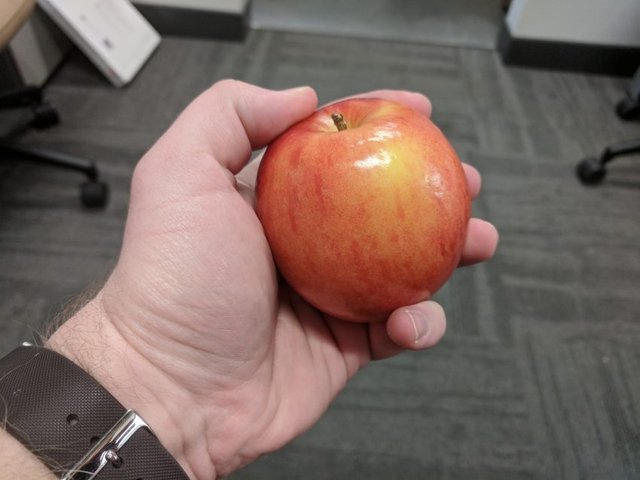
Imagine you are blindfolded and handed an apple without being told what it is. You could use your fingers and sense of touch to feel the shape and texture of the object, and you'd be able to conclude it is indeed an apple without seeing the object with your eyes. Atomic force microscopy, or AFM, is a surface imaging technique that uses a small cantilever to image a sample by "touching" it. The movements of the lever are mapped by software to generate an image of a sample simply by coming into contact with it, just like your brain could do with the apple.
One of the advantages of using a technique that makes physical contact with the surface is that AFM may be performed in almost any conditions, making sample preparation fairly simple compared to other microscopy techniques. For example, scanning electron microscopy requires the sample to be conductive and the technique must be run in a vacuum. Neither of these conditions are necessary for AFM, but AFM could be used on a conductive sample and may be run in a vacuum if necessary!
The greatest advantage of AFM, however, is that while the lever is scanning across the sample in two dimensions (length and width), it is also generating data in the third dimension (height), which allows a 3D surface image of the sample to be constructed. Therefore, AFM generates a 2D surface image as well as a 3D surface profile, something that other microscopy techniques are incapable of.
AFM may also be used on length scales that are smaller than other microscopy techniques. Depending on the instrument, an AFM may be used to image features in the sub-50 micrometer range down to 1 nanometer.
Finally, AFM may be used to determine characteristics of a surface after imaging has been done. We'll discuss this more in detail later, but for now, just know that you can get values like surface roughness or the elastic modulus of a surface (how stiff or soft it is).
AFM is one of my favorite techniques for a variety of reasons, but mostly because of its versatility compared to other techniques. So just how did science develop such a marvelous image technique? Let's take a look at the history of AFM.
History

The technology of surface profiling can be traced back to the 1920s, when a German scientist named Shmalz described an instrument which used a sharp probe to trace out the features of a surface, achieving a magnification of around 1000x[1]. In 1950, Helmut Becker and associates filed a United States patent for an instrument that oscillated the probe to avoid crashing into larger features on the surface[2]. This led to the invention of the topografiner, in 1972, a non-contact imaging method, which allowed even higher resolution [3]. This instrument relied on electronic interactions between its probe and the sample, and thus depended on the vibrational capabilities of the instrument[1].
The modern predecessor to the AFM is a scanning, tunneling microscope (STM), which improved upon the topografiner by measuring electronic tunneling between a probe and a conductive sample[4]. This invention was so revolutionary that its creators won the 1986 Nobel Prize in Physics.
STM is still used widely today to characterize conductive materials and semiconductors, however its ability to only work on conductive materials is a setback that would be addressed by the invention of the AFM. In 1986, Gerd Binnig, one of the aforementioned Nobel laureates, published the first use of atomic force microscopy[5]. The new instrument mapped the profile of a surface using tunneling measured via a wire suspended above a gold spring with a diamond tip glued on, which would become the first ever AFM cantilever[1].
After this invention, many other scientists began improving upon the technique, which has resulted in much of the technology that I currently use to characterize samples. There are many commercially available AFMs today, so it's no surprise that there are many of the instruments across the university where I'm a graduate student.
So now that we know how AFMs came to be, let's look a bit deeper into how they actually work.
How it Works
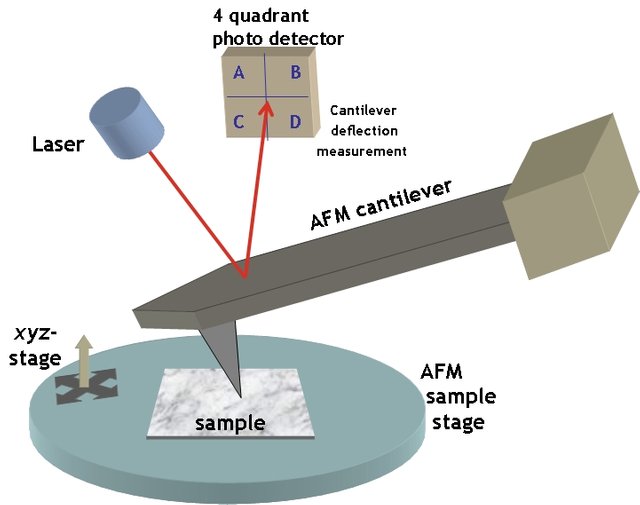
You already know that an AFM uses a small cantilever's movements across a surface to generate 2D and 3D profiles. How does this happen?
The Cantilever
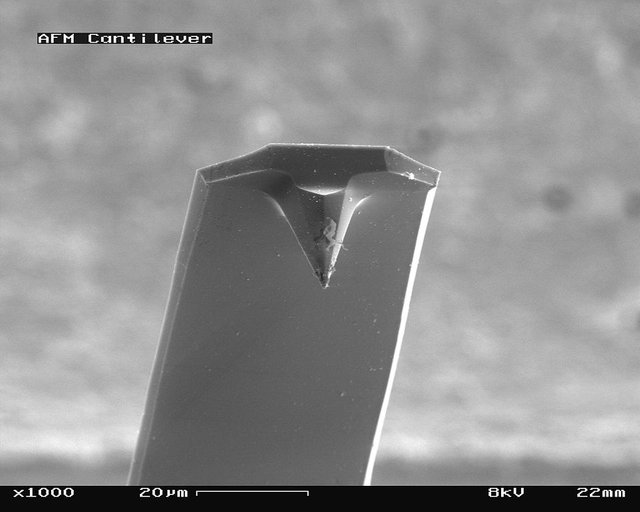
First, we need a cantilever, or the piece of the instrument that actually comes into contact with our sample. These are often made of precious metals or silicon and are very small. So small, in fact, that you'll need an optical microscope to see the tip. Most tips have a micron-sized lever with a sub-micron-sized sharp tip on the end. The sharp tip is what will contact the surface that you're profiling. The sample you are characterizing is generally loaded into the instrument first, and then the scanner assembly may need to be configured depending on the instrument.
Note that the cantilever may also be referred to as a probe or tip. I may use these terms interchangeably.
The Scanner
The scanner contains components called piezoelectric transducers, which are "electromechanical transducers that convert electrical potential into mechanical motion."[1]. These elements are important for the actual movement of the cantilever across the surface of your sample.
Force Transducers
After placing your sample into the instrument and mounting the probe, the next step is to align the instrument's force transducers, or the part of the machine that measures the extremely small forces between the surface and the tip. Most instruments, including the one that I use frequently, rely on a type of force transducer known as an optical lever sensor[1]. The concept is fairly simple. Each cantilever has a reflective surface on the side opposite of the tip. Instruments with optical lever sensors shine a laser at this reflective surface, which is directed into a detector. Once the cantilever begins to move along the sample, slight shifts in the laser's path to the detector are translated by the instrument and software into movements, which may be used to generate the images.
Feedback Loops
AFMs have intricate feedback control loops that help keep the tip at the proper height just above the surface. If you're unfamiliar with control loops, think of when you're in the shower and the water is too cold. Your body senses the temperature, and you take action to change the temperature by adjusting the hot water level. This is a control loop. There is a desired value that you want to achieve, something that senses the current value. If the value is too high or too low, an actuator changes a condition and the loop starts again. In this simple example, the temperature of the water is the desired value, your sense of touch is the sensor, and your hand on the hot water control is the actuator.
An AFM makes use of automated control feedback loops to ensure that the tip is as close as possible to the surface. If a surface has many features, some may be slightly higher up than others, so as the tip is moving across the surface of a sample, if it encounters an object higher than its current position, a signal is sent through the piezoelectric transducers to the scanner to raise the tip slightly to account for the object. The same happens if there is a valley or a lower part of a sample.
Put Them All Together
Combine all three of these components: piezoelectric transducers, force transducers, and feedback loops, and you've got an AFM setup that is ready to image a surface. As discussed previously, almost any type of sample may be imaged with an AFM, but samples may require preparation before they are ready to image.
For the purposes of the photos and procedure in the rest of this blog, I will be describing the process on an Asylum Research Cypher ES AFM.
Sample Preparation
One of the brilliant attributes of AFM is its ability to image almost any type of sample in many different environments. AFM may be performed in ambient air, under vacuum, at high and low temperatures, and even in liquids. Depending on the instrument, samples may need to be prepared in various ways. Generally, a small section of a sample smaller than one square centimeter is ideal for scanning with an AFM.
When I prepare my membranes for imaging, I cut a small sample out and use double-sided tape to secure it to a small, round magnet. This magnet holds the sample in place when it is put into the instrument. Here's a photo of what my samples look like mounted onto the magnetic disk:
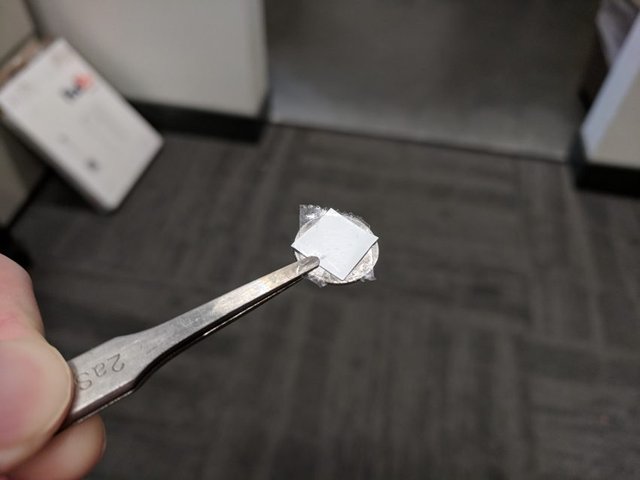
Generally, samples should be clean. If you have dust or other debris on the surface of your sample, it may be mistaken for a feature since AFM is so sensitive to small objects. Otherwise, if you have a sample that may be cut into a small piece, you should be ready to go. If not, imaging may be a bit more challenging, but there are sample preparation guides for materials throughout the literature and on the Web.
Once the sample has been prepared, it's time to image it!
Imaging
Cantilever Selection
The quality of imaging is directly related to the choice of cantilever.
AFM tips come in many varieties, depending on the application you're using them for. They vary in stiffness, so you'll often see a k value, or spring constant listed as one of the primary attributes of a given cantilever. If you're curious about the varieties of tips, check out one of the online stores for purchasing them.
Once you've selected a cantilever that suits your application, you'll load it into the instrument. This can be a bit tricky since the probes are so small. Most instruments have specific mounts for the cantilevers that may be manipulated with a small screwdriver, so a good pair of forceps will do the job to slide the cantilever into place. Here's a quick clip of me performing this process on the instrument that I use frequently:
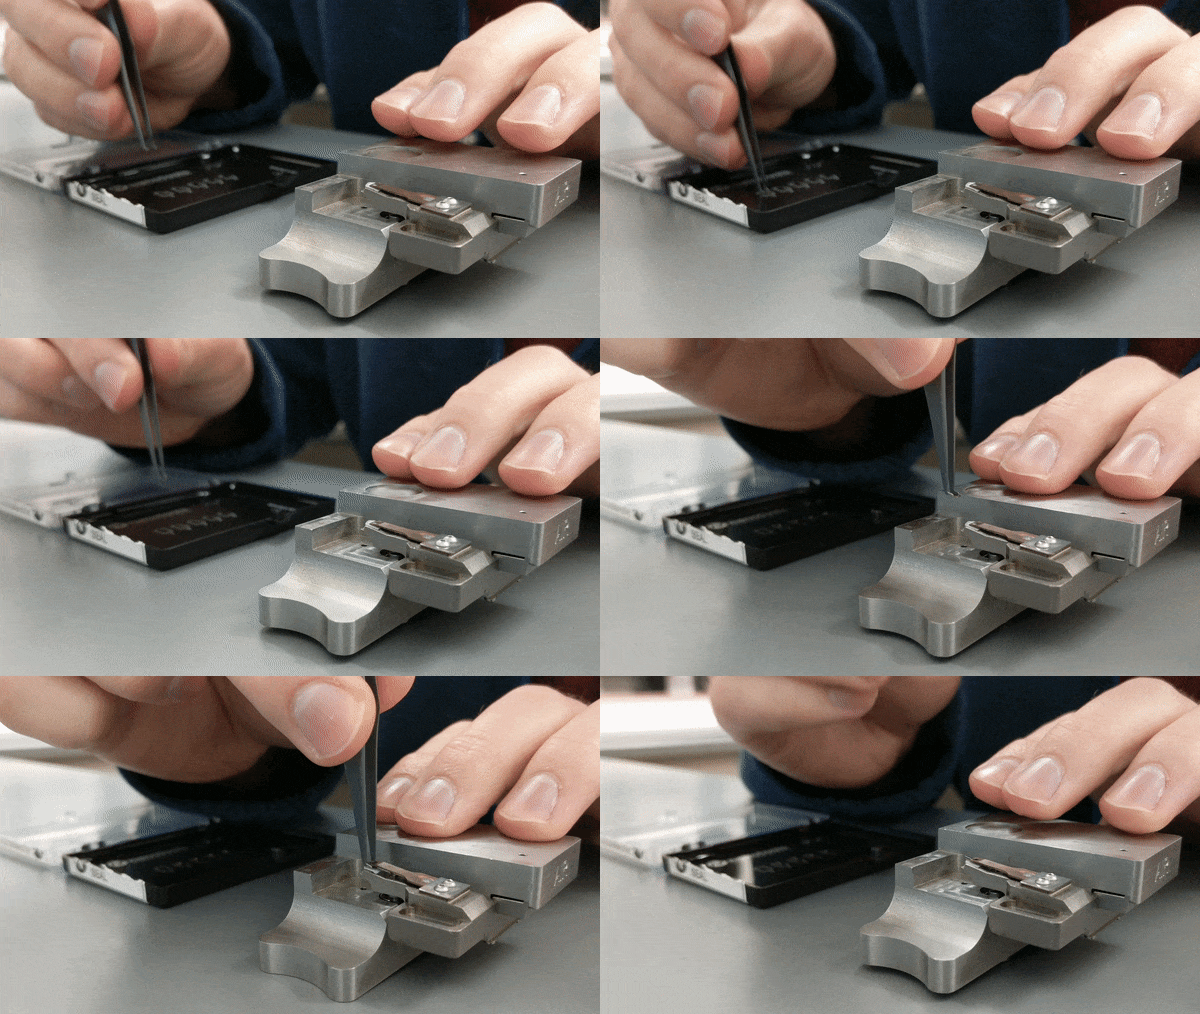
You can see the tip is the very small object that I am lifting with the forceps.
Once the tip is in place, the holder is mounted into the instrument. The holder is also known as the scanner, which contains the operating elements discussed in the How it Works section. Scanner types may vary between instruments. In fact, the instrument I normally use has two different scanners that can be swapped out fairly easily. One is open to the air, and the other allows the use of liquid environments and various temperatures.
Tip Calibration
Before getting right to the imaging, each tip must be calibrated based on readings on a stiff sample. The calibration step is to calculate the two values necessary for the use of Hooke's law (F = -kx), where F is the force, k is the spring constant, and x is the distance the cantilever moves[6]. I generally use a small platinum calibration grid to do the job. There are a few parameters that must be calculated for each tip before imaging to ensure that the signals are translated into a proper image. The first value to calculate is x, which has a specific name: the inverse optical lever sensitivity, or Invols. This value may be calculated by bringing the cantilever close to a hard surface and moving it down a known distance, generating a graph of cantilever deflection vs. distance, and the slope of the line on this graph is the Invols value[6].
The second is the spring constant of the cantilever. These values are reported as approximations on the box of the tips when purchased, but it is ideal to calculate the exact spring constant. The exact process of this calculation is made simple by the software of the AFM, which uses measurements to find the resonant frequency of the tip and calculate its spring constant.
A Note on Imaging Modes
There are multiple modes of imaging in AFM. The most common is contact mode, where the cantilever comes in direct contact with features on the surface, and its movements are mapped based on the movements of the cantilever as it passes over surface features. Images may also be taken in oscillating mode (or tapping mode), where the cantilever oscillates at its resonant frequency, leading to smaller forces acting between the cantilever and a sample. If it is desired to use tapping mode, this resonant frequency must be calibrated before imaging. I'll discuss the differences between the imaging modes in a later section, but I wanted to let you know that the calibration step involves different parameters based on the imaging mode chosen.
Once the Invols and spring constant are known, the tip is ready for imaging, so any desired sample may be placed into the AFM for scanning.
Note that the following steps are necessary to calculate the Invols and spring constants initially, but I have chosen to detail them here instead.
In order for the instrument to generate an image, the cantilever must be aligned within the optical force transducer, as discussed earlier and seen in Figure 1. On many instruments, this requires manual positioning of the laser beam onto the reflective portion of a cantilever using micrometers. Fortunately, the instrument I use has an automatic align function for the laser that works with a camera mounted above the cantilever on the instrument (you can see this camera view in Figure 5).
Once the laser has been aligned, the tip must be moved into close proximity with the sample so that it will be able to image. In many AFMs, this is another manual step that requires careful precision. However, newer models allow the user to find the sample surface in the camera window. Once the surface is in focus, the height position of the sample is remembered by the instrument, and clicking a button in the software will move the cantilever down within a preset distance from the sample (usually around 50 microns). Then the instrument can lower the tip very slowly until it senses that it has touched the surface. Once this step is completed, it's ready to take an image!
Adjusting Initial Parameters

There are a few more adjustments that need to be made in order to ensure the best imaging possible. In both imaging modes, a constant value for cantilever deflection must be defined. This value is known as the set point, and it is generally set to the minimum amount of force to keep the cantilever on the surface of the sample[7]. Other values that may be set before scanning include the angle at which the probe scans, the integral gain for the feedback loop, scanning speed, and scan size. I'll discuss all of these in detail in the next section.
Once these initial parameters have been defined, the instrument is ready to generate an image. Knowing what settings to use at the beginning is an acquired skill. Often you can't know what settings will be optimal until you've begun imaging. Here are a few of the parameters involved in achieving optimal images with AFM and how adjusting them can affect imaging.
Set Point
As mentioned earlier, this is the value of force applied on the cantilever to keep it touching the surface. If the value is too low, the tip does not come into contact with the sample, so no image will be generated. If the set point is too high, the cantilever may press into the sample too hard, causing potential damage to both the probe tip and the sample. Therefore, it's a good idea to start lower and increase the set point rather than start with a high value.
Scan Size
This value, usually somewhere between a few nanometers and 30-50 microns, is the value of one dimension of the 2D image generated by the instrument, e.g. for a 30 micron scan size, the resulting image will show a 30 micron by 30 micron section of the sample. When imaging a sample, if the size of the features you are looking for are known, you can use that information to decide how large to set the scan size. It's usually a good idea to start with a larger scan size and get smaller, zooming in on any interesting features that may appear. Keep in mind that when imaging, the resolution of the image is dependent on the size of the tip, so any images generated over areas smaller than the tip size will show little or no features.
Scanning Speed
When you begin imaging, an AFM generates the image by moving the cantilever back and forth across a section of the sample defined by the scan size. Adjusting the scanning speed tells the instrument how quickly to move back and forth. Lower scanning speed generates better resolution, but at the cost of time. Higher speeds are faster, but may not produce high quality images since the cantilever has less time to respond to sudden changes in the surface topography. Therefore, it's a good idea to begin with a fast speed to get an idea of what the area looks like, and slow it down once you know which areas you want to focus on.
Integral Gain
As I mentioned in the How it Works section, a feedback control loop is present in the AFM to determine how the cantilever moves when it encounters a new feature. The example I gave of the water temperature in that section is an example of manual control. The AFM cantilever movements are controlled by an automatic controller. Automatic controllers can have a few different types of controls, typically proportional (P), integral (I), and derivative (P). If you are familiar with these terms from mathematics, they aren't difficult to understand. Each describes the response initiated by the controller when a difference from the set point is present. If you aren't familiar with these terms, don't worry, all you need to know is that by increasing the Integral Gain value, it changes the response of the controller based on the signals it is receiving. So often increasing this value gives better images, but only to a certain point. Increase it too much, and you'll get oscillations in the data stream.
Obtaining an Image
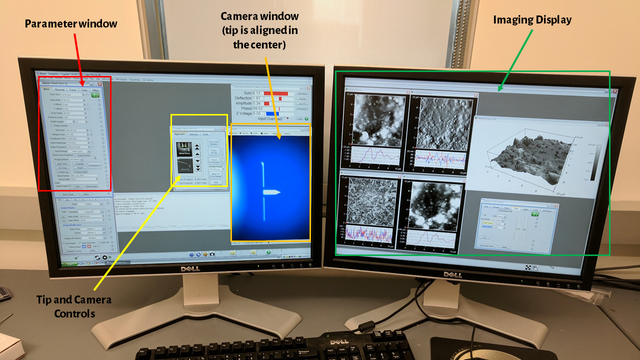
When you finally press the "Do Scan" button in the software, it feels great. You're not ready to sit back yet, though, because all of the parameters I just discussed often must be adjusted as you image to ensure the best quality is obtained.
This can be a tedious process that involves trial and error, as well as several scans and many hours of waiting on images, but the results are worth it. Keep in mind that AFM allows one to obtain not only a 2D image of a surface, but also a 3D profile of the surface.
The above image shows the software interface during imaging, with various sections of the software highlighted. The red window is the parameter window, which allows all of the parameters I discussed in the previous section to be manipulated. The yellow window is the camera and tip controls. The camera focus may be moved up and down, and the tip may also be moved up and down. The controls to set the sample height and automatically move the tip are also on this window. In orange, you can see the actual tip via a camera. This window is to find the sample height and observe the tip during imaging. Finally, in green, you'll see images displayed, both 2D and 3D from the sample.
My AFM Images
I want to share a few images that I have obtained using AFM during my PhD research. I'll describe what each image represents as we go. My research project involves polymeric membranes for use in desalination (salt water filtration). Therefore, we are often interested in how the polymer structure of the surface of the membrane forms.
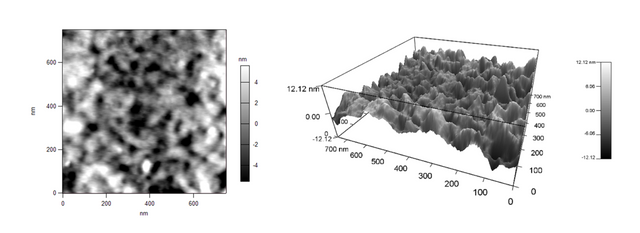
Last year, I tried a new casting technique for a polymer, and I wanted to compare the surface of the membranes that I cast with ones we had obtained from a commercial source. This was mainly because I couldn't get my membranes to work properly, and the commercial ones worked excellently. Imaging the surface could offer insight into where I was going wrong in the casting process. Here's the image of the commercial membrane in 2D:
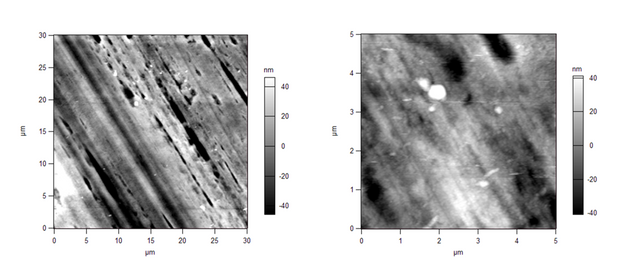
And in 3D:

The original software that obtains these images allows for manipulation of the 3D images, so you may view them from any angle and side. You may also add colors to indicate the height of various features.
When we compared the above images with the images of the membranes we had cast, we saw stark differences. Here's our membrane in 2D:
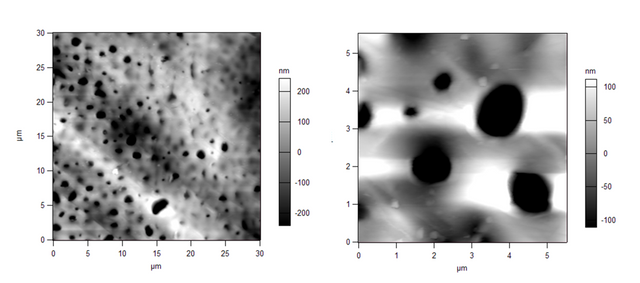
And in 3D:

We immediately determined that the commercial membrane was made via an automated process, therefore the pore sizes and shapes are far different than ours. The pores on the commercial membranes are long and trench-like, as seen in Figures 1 and 2, whereas our lab-made membranes have circular pores, seen in Figures 3 and 4.
I've been able to image many other surfaces related to my research, but I am unable to include them at present since we will be using them for a publication soon. I hope you'll be able to see some of the interesting aspects of AFM via these images. They aren't the greatest images, but all you have to do to see more fascinating examples is search online for AFM images. You'll find many incredible scans!
Imaging Modes, Revisited
I mentioned the two common imaging modes earlier: contact mode and oscillating (tapping) mode. Once again, in contact mode, the tip is always in direct contact with the surface. In tapping mode, the tip oscillates at its resonant frequency as it moves across the surface, so it is still touching the surface, but at smaller intervals, hence the name of tapping mode. I wanted to revisit this topic to explore the advantages and disadvantages of each mode.
Contact Mode
Contact mode was the first mode of scanning developed for AFM[9]. Since the tip is in contact with the surface at all times, contact mode offers very high resolution, which is its main advantage. However, since the probe is touching the sample at all times, both the tip and sample are at risk of damage. There are also strong lateral forces present, which may lead to small features or deposited samples being incidentally removed from the surface by the tip[9]. Contact mode remains one of the best modes to obtain high resolution images, however, one must always keep in mind the properties of each sample before imaging to ensure that contact mode is most appropriate.
Oscillating (Tapping) Mode
As described above, in tapping mode, the cantilever is oscillated at its resonant frequency as it moves across the surface. When it comes near a surface feature, interactions between the tip and the feature cause a slight change in the oscillations, which is translated to the force transducer, which adjusts the height of the tip via a feedback loop[9]. This intermittent contact between the tip and sample eliminates lateral forces experienced in contact mode, therefore it is desirable to image small surface features that are not strongly bound. Since the tip does still come into contact with the sample, there is still a risk of sample or tip damage from the applied force.
Choosing a mode is largely dependent on the sample and the medium in which you are scanning. I usually begin with contact mode, and if I can't get a good image, I'll switch to tapping mode to see if it improves.
Now that you've seen some images and learned about the most common modes, let's talk about the other things you can learn from AFM.
Surface Roughness Measurements
After obtaining an image of the surface, AFM software may be used to calculate a measure of how rough the surface is. The most common measurements are root mean square roughness (RMS) and roughness average, but there are other quantities that may be utilized to get an idea of how samples compare with each other.
Generally, these roughness measurements are used to compare among samples in a set rather than comparing them to other roughness measurements reported in scientific literature. The readings also must be carefully analyzed since they are most often taken from a very small section of the sample (sub 50 microns) which may not be representative of the roughness of the entire sample.
Roughness measurements nevertheless have their usefulness, and AFMs make it easy to obtain a number associated with roughness.
Modulus Measurements
In addition to imaging samples, an AFM may also be used to calculate the modulus, or how hard or soft a sample is. This is accomplished via the collection of force curves, which are recorded by the instrument when the cantilever is pressed down and withdrawn from the sample.
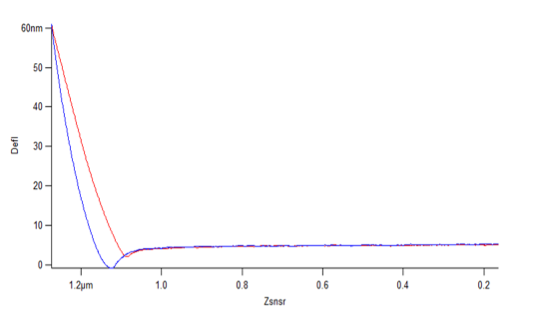
From these measurements, models have been developed to calculate a modulus value using the slope of the force curves. These measurements can be extremely useful when interested in the mechanical properties and stability of a sample. They may also be used to compare the modulus measurements between samples in the case where chemistry is varied slightly, or one of the samples has been exposed to different environmental conditions.
The models to calculate the modulus involve various mathematical equations, but the one I have used most frequently is Hertz's law, which allows calculation of the Young's modulus if one knows the force and the size and geometry of the cantilever tip[8]. If you're interested in learning more about this process, I encourage you to read this article, which explains modulus calculations in greater detail.
My Personal AFM Experiences
I've drawn from many of my own experiences when discussing the topic of AFM. I have used the technique on many different types of samples, and I will continue to use it in the months ahead, as we've just renewed a project that involves heavy use of AFM. It's been a lot of fun, but it hasn't been without its challenges. I have been fortunate to have another graduate student teach me the core concepts of AFM and how to take measurements myself. I am in no way an expert, so if there is an AFM expert reading this post, feel free to point out my errors.
Not long ago, I encountered a situation that required me to calculate modulus measurements, but the samples would not cooperate with the cantilevers I was using because they had a very low spring constant. Once I obtained some stiffer tips, it turned out that the tip geometry was unique, which did not fit into the mathematical model I had access to. So another graduate student and I decided to try to modify the geometry of the cantilever by attaching a 20 micron in diameter silicon sphere to the end.
It was a very tedious process involving micrometers, a microscope with a camera, and ultraviolet curing glue. It sounds complicated, but we were really just trying to stick a very small sphere on the end of a tiny cantilever. The idea was to place the sphere over the tip of the cantilever so that when in use, the sphere will touch the surface of the sample instead of the tip as per usual. When we tried the first time, in order to find out if we were successful or not, we had to look at the cantilever under a microscope. To our dismay, this is what we saw after our first attempt at mounting the sphere:
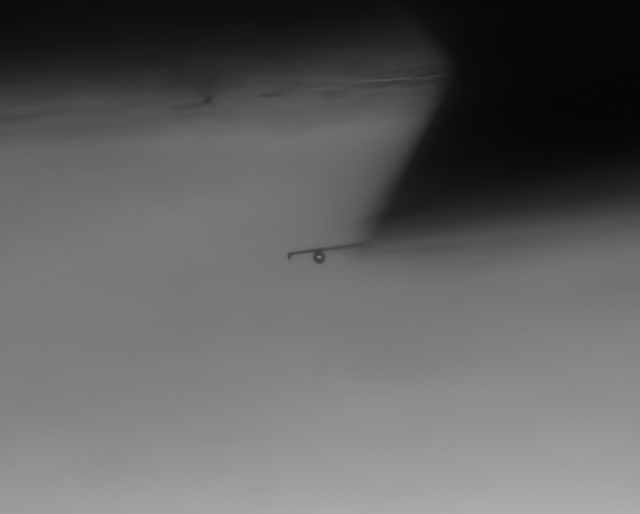
You can see the cantilever and tip clearly in this image, and you can also see the sphere, which ended up too far back on the cantilever. It's difficult to describe the wave of disappointment that ran over my body when I peered through the viewfinders on the microscope to see this. The process of mounting the sphere had taken around an hour already, so I knew all that work had been for nothing.
So we tried again, this time with a different method. Eventually, we did get one to work after a few more tries. Here's what it should look like:
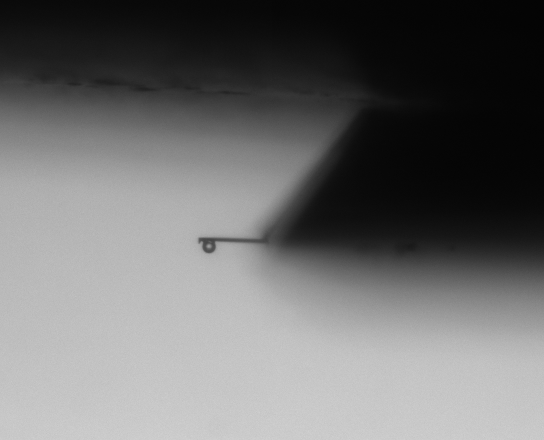
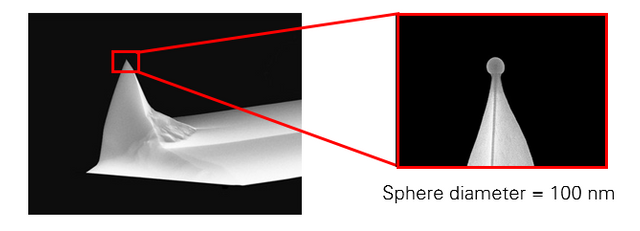
I was able to use this tip to perform modulus measurements, but ultimately, this method proved inconsistent. We decided instead to purchase some tips that are pre-made for this type of work, which have a much smaller and more precise sphere mounted on the end. Here's an example from Asylum Research:
Not exactly the most glamorous aspect of graduate school, but it was still an interesting experience for me to learn about modifying probes, even if all of the work ended up unusable. I've learned that many times throughout graduate school, you are forced to learn through mistakes and failures, because they occur much more often than successes.
Final Thoughts
Learning how to perform AFM has been one of the most useful analytical skills I have acquired in my time as a graduate student. I plan to continue using the technique throughout the rest of my degree to help gain insight into the processes occurring at small scales within my samples.
I hope you've enjoyed learning a bit about one of the most powerful microscopy techniques science has given us. I personally learned a lot about AFM during my research for this post, and there's so much more information about AFM available. If you are interested in learning more about AFM, Here are a few great resources:
- Atomic Force Microscopy by Peter Eaton and Paul West. (A fantastic in-depth textbook on AFM, and my primary source for this article)
- Atomic Force Microscopy on Wikipedia
- Atomic Force Microscopy Lecture Slides from the University of Utah (These have many great images which help explain the concepts I've discussed.)
- Google Image Search for AFM images (there are some great images out there!)
If you have any questions about this technique or my research, please feel free to leave a comment or catch up with me on Discord. This article is the culmination of many hours of research and planning, so I hope it will forever remain on the blockchain as a resource for learning about AFM.
Finally, I want to thank the #steemSTEM and #steemiteducation efforts for inspiring this post. It is my first attempt at a SteemSTEM article, but I hope that I'll be able to publish many more to contribute to science and achievement across Steemit and beyond.
References
- Eaton, P., & West, P.(2010-03-31). Introduction. In Atomic Force Microscopy. : Oxford University Press.
- Becker, H.; Bender, O.; Bergmann, L.; Rost, K.; Zobel, A. Apparatus for measuring surface irregularities. United States Patent number: 2728222, 1955.
- Young, R.; Ward, J.; Scire, F., The topografiner: an instrument for measuring surface microtopography. Review of Scientific Instruments 1972, 43 (7), 999–1011.
- Binnig, G.; Rohrer, H.; Gerber, C.; Weibel, E., Surface studies by scanning tunneling microscopy. Physical Review Letters 1982, 49 (1), 57–61.
- Binnig, G.; Quate, C. F.; Gerber, C., Atomic force microscope. Physical Review Letters 1986, 56 (9), 930–33.
- Proksch, R. and Cleveland, J. Quantifying Molecular Forces: Sensitivities and Spring Constants without Touching a Surface. Asylum Research.
- Eaton, P., & West, P.(2010-03-31). Measuring AFM images. In Atomic Force Microscopy. : Oxford University Press.
- Roa, J.J., Oncins, G., Diaz, J., Sanz, F., and Segarra, M. Calculation of Young's Modulus Value by Means of AFM. Recent Patents on Nanotechnology 2011, 5, 27-36
- Eaton, P., & West, P.(2010-03-31). AFM modes. In Atomic Force Microscopy. : Oxford University Press.
Unless otherwise noted, all images are my own or were obtained via Pixabay.


This is really a long read. Although I may not understand everything I read, but I am surely benefitted from your post and some new found terms that I have never met before. The best micrscope that I had handled was the one we use in normal lab. You know, those to see cells. So this is another level for me. I am a graduate of Chemistry and Biology and still I have never come across AFM. Maybe chemical engineering is a entirely different journey.
It is amazing how science has developed to such an extent manner, while I read and read what you have written, I just kept "Wow, seriously this could be done?" Human are genius. You are one of them.
I love how enthusiastic you are in your research. It shows in your post - detailed process. And your never-give-up spirit is praiseworthy.
Why I am interested in your post although it took up some time to read, because my son recently join STEM at his school. It is an extra Interest Class he signed up for. So I also wanna keep up with STEM.
Thank yor your time and effort to create this post. So much knowledge in here. ;)
It's always great to find out how has science backgrounds here on Steemit! I'm not surprised that you haven't heard of AFM since you have a chemistry and biology background. Most chemists aren't concerned with surface properties of materials unless they are working with catalysis, but there are many biological applications for AFM. The other graduate student I'm working with uses AFM to map bacteria formation on surfaces. So that's pretty neat.
It's great that you stopped by to take a look at this behemoth of a post. I don't feel like a genius most days, though, even though I appreciate the compliment. The more I learn about processes like this, the more I realize I don't know. But that's part of the process.
STEM subjects are great. My wife teaches elementary, so she enjoys letting her students do STEM projects, especially in engineering subjects. I hope you enjoy reading the post, and please don't hesitate to ask questions if you have them!
Never heard of Atomic Force Microscopy before, so thanks for the very interesting and comprehensive dissertation @ethandsmith! But you have me (as usual) off on a tangent here, into desalination...
My Dad at one stage proposed a device separating the salt ions by means of a moving magnetic field relative to the solution, thus forcing the ions apart in directions perpendicular to the field, then harvesting the somehow electrically neutralized ions sideways and desalinated water from the middle.
I am personally not very optimistic, seeing possible problems in terms of energy of separation and of physical removal of resulting metals and gasses..but who knows, maybe a little research in this direction can still lead somewhere!
I'm glad you enjoyed the article!
That's an interesting thought for desalination. I would have to look into that concept. Any idea if that work was published? I'd love to read more about it!
It's fascinating to consider other methods for desalination. For my research, we've hit a bit of a wall when it comes to improving the membrane technology, so I'm looking at how nanotechnology can help that.
I hope to post more about my research in the future! Thank you for taking the time to read and respond!
The principle is simple, as described above. The physical implementation is a bit of a challenge.
My dad used a rotating so-called homopolar field setup - a spinning circular U shaped trough with effect an infinite number of magnetic North poles on one edge of the trough and the same but South poles on the other side, thus creating a rotating array of radial magnetic field lines across the circular trough within which to do the experiment. Although he had access to machinery to construct a working model, he did not have either the financial capital to investigate all avenues from this point on, nor a sufficiently sophisticated lab at his disposal for testing results. Sound like your establishment could supply you with all the necessary equipment for something like this!
I honestly don't know of any publications, except for perhaps a preliminary patent file somewhere. A little hard to lay my hands on 4 + decades on!
I still think that's fascinating, so thank you for sharing. It's still a bit difficult to envision, but it sounds extremely sophisticated.
If I come across anything similar in my research, I'll be sure to let you know!
Wouldn't mind seeing if it can in fact produce results! Thanks for your interest.
That's a really interesting post! :) It's awesome that you delved deep into the topic, I enjoyed reading it a lot :)
I'm so glad you enjoyed it! I plan to share more posts that have to do with my PhD research in the future, so I hope you'll be able to read them, too.
Do you have any experience with analytical techniques like this? I'm just curious. It's been interesting to hear from other people with science backgrounds here.
Sure, keep writing on those topics, I find this stuff fascinating.
I wouldn't say I have a similar background as I'm more of a fan of science and knowledge rather than a proper scientist. But that's even more reason for me to be interested in reading about this type of tools and work. I've read about techniques like this before and I would love to read more.
To try and describe my scientific and academic background, I'd mention that I never finished my university education, but I've been a high school teacher teaching English and Physics. I guess that's a weird combo.
Thanks for sharing a bit about your background! I have high respect for teachers since my wife is one, and yes, I believe English and Physics is an interesting combination.
I'm glad you found this article interesting. There are a lot of interesting physics involved with AFM because of the attractive and repulsive interactions between the tip and the surface. There's a great online textbook about it if you want to read more that is available for free. I mentioned it at the end of this post, but here's the link again in case you want to check it out. Let me know if you have trouble accessing it.
Thank you again for your engagement and interest in my blogs!
This is a detailed and great article on AFM. Thanks. Following, upvoting and Resteeming!😃 Best wishes from India. @ethandsmith
Thanks for visiting the post, @dexterdev! I appreciate your comment.
Did you have any prior knowledge of AFM? I've found that most people haven't heard of it, but I'm just curious!
I am a computational biology student. Last year I got a chance to attend EMBO cell mechanics workshop where professors were talking about AFM. And we had option to try out two experimental techniques. But I chose optical trap and microfluidics experiments. So no hands on experience 😃
There's a group at my university that works with microfluidics for biological applications, so I imagine that you chose more relevant topics. AFM is really neat. I've never done any measurements on living cells, but one of the students in our department regularly images bacteria with AFM as part of his research.
Good to meet another scientist!
Are you in steemSTEM discord channel? If so is it okay to DM you?I am really happy for for this platform which allows me to meet great guys like you. BTW I don't do any wet lab experiments. In past I was an electronics engineer. 😂 Now I am doing molecular Dynamics of biomolecules!! 😃
Yes! I just joined the channel this week. My username is the same on Discord as here. My research is far from biomolecular unfortunately haha my biology knowledge is severely lacking.
My main research right now is in polymeric membranes for desalination. I'm planning to do some more Steemit blogs about it in the near future.
Feel free to message me any time!
I'd never even heard of AFM before this, that's super cool! I really enjoy learning about different microscopes, this one's super different from the mineralogical microscopes I'm most familiar with.
It's surprising sometimes the analytical techniques that you never are aware of in certain fields. There are a lot of instruments my geologist friend tells me about that I've not heard of. I enjoy collaborating with other groups on our campus because of this. I've learned so much that I otherwise would never have known!
Thanks for stopping by to comment!
Being A SteemStem Member
Nice job! This is a topic am not really that familiar with but it was a pretty interesting read. I'll be also looking forward to your post about desalination, the government of my country has been working on 2 desalination plants in my state with the aid of China for a while and I understand just the bare basics of how the process works...
Thanks for the feedback! I decided to use Steemit as a motivation to prepare myself for the lecture next week, and the post ended up much longer than I first thought it would be. I considered splitting it into multiple posts, but I wanted to just get the whole thing out there because I'm proud of how it turned out.
As far as desalination, I'll have to focus a few blog posts on the process and the science behind it. That could help me when I'm writing parts of my thesis, so I'll definitely consider that in the future. There are a lot of great discussions to be had about water purification and membranes!
I appreciate you stopping by!
This field suits you well. You are detailed oriented. Also this is a comprehensive piece. Thank you for sharing. Sometimes I think the world won't understand or care what I am doing today but you show from your post your passion for science and then others care.
Thank you very much for your kind words!
I've enjoyed learning more and more about what's out there in the scientific world. I'm glad that I can share it with the Steemit community! Thank you for stopping by!
Congratulations! This post has been chosen as one of the daily Whistle Stops for The STEEM Engine!
You can see your post's place along the track here: The Daily Whistle Stops, Issue # 41 (2/10/18)
The STEEM Engine is an initiative dedicated to promoting meaningful engagement across Steemit. Find out more about us and join us today!
damm its working seems to be so fascinating to me ...wonderful to read more about it from your blog post must have been an awesome experience to see it in real for sure :D
It's always enjoyable to run techniques like this and learn more about the surfaces of my samples. It's a privilege to be able to work with some of the instruments that I do, so I enjoy learning more and more each day. Thank you for stopping by!